Articles by Phil Segner Sr. Research Analyst & Co-Portfolio Manager
Estimating the Downside - February 2025
Our Normalized S&P 500 P/E multiple (31.5x) ended January just below the contemporary high-water mark of 32.2x set at the end of November. This is the eighth consecutive month the ratio has been north of 30x—the threshold associated with previous market bubbles.
EPS Pointing Higher
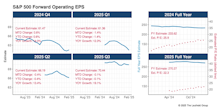
The S&P 500’s estimated bottom-up operating EPS nosed slightly higher during the first month of Q4 reporting (Chart 1). That’s a win in the usual slow-erosion, forward EPS game. The index is on track to expand operating earnings at 14% YOY for the last quarter of 2024, which would be the highest since Q2-23 (+17%) and well above the 4% average we’ve seen over the past three years. Full-year 2024 operating EPS is starting to crystalize around $233—a 9% improvement from 2023’s results. At present, EPS growth projections for 2025 are just shy of 16%.
Inflation: Sticky But Contained?
.png?fit=fillmax&w=222&bg=FFFFFF)
December’s Core CPI figures we’re cooler than expected. Markets reversed out some of the damage caused by Friday’s hot jobs report. The market is pricing in only one or two Fed cuts in 2025, down dramatically from this fall.
4% Club Getting Crowded
.png?fit=fillmax&w=222&bg=FFFFFF)
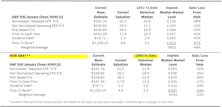
New Years Eve 2024 was a party to remember for the 4% Club (stocks with a minimum 4% weight in the S&P 500). Thanks to December’s ridiculously top-heavy performance, a record five firms toasted the new year in the VIP-only Club (Chart 1). For most of the past five years, membership had been limited to two or three companies. Before that, the Club’s March 2000 high-water mark of three firms seemed unobtainable—and, with a little hindsight, a laughable signpost of the Tech Bubble. Well, who’s laughing now?
Leuthold’s Industry Group “Dreams” And “Nightmares”—Annual Update
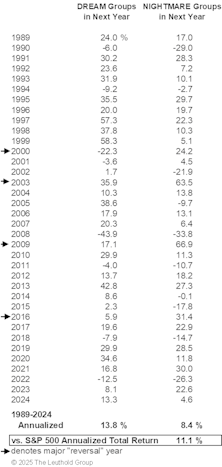
Over the entire history of this study, the momentum plays of our “Dreams” and “Nightmares” have worked both ways. Like everything else, our Dreams fell short of the Cap Weighted S&P 500 in 2024. However, the spread of Dreams over the Nightmares was fairly impressive.
Other Market Undercurrents

The Equal Weighted and Cap Weighted S&P 500 turned in eerily similar absolute returns for the past two years. The real shocker being the yawning, but nearly identical relative gap between the two from year to year (12.4% and 12.7%). The 29% performance void is the largest 23-month gap we can calculate since 1990. The next closest being April 1998 to March 2000 (27.9%).
Leadership Dynamics: Growth/Value/Cyclical

Over the past two calendar years: Royal Blue Growth +73%, RB Value +29%. The P/E multiple for our RB Growth segment now sits a tick above is previous contemporary high of 45.0x (Q4-2021). In the aftermath of that high point three years ago, the P/E multiple collapsed to 30.1x over a span of three quarters.
Valuations: Small Cap Vs. Large Cap

Our Ratio of Ratios ends 2024 in the middle of its range for the year (21-29% Small Cap discount). We enter another new year with this vignette advising that Small Caps can be purchased at a steep discount to Large Caps. Of course, this study said the same thing in January 2020, 2021, 2022, 2023, and 2024.
Trend Still Positive

The Up/Down ratio is 1.36—the best “final” quarterly figure we’ve logged for this vignette since Q3-21. After two years of readings that are normally associated with recessions, YOY EPS growth has certainly become more common thus far in 2024, with three quarters’ reports in the books.
Estimating the Downside - January 2025
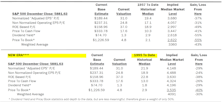
The S&P 500 lost 2.5% in December but fared far better than both Mid- and Small-Cap Indexes (S&P 400 -7.3%; S&P 600 -8.1%). From today’s level, the S&P 500’s potential downside to its 1957-forward median is -43%.
Estimating the Downside - December 2024

The S&P 500 returned to its winning ways in November, logging its largest monthly advance (+5.7%) in a year; over the last 13 months, the index has a price gain of 44%.
Other Market Undercurrents

The index was not the star of the November surge, as a decisive election result and the possibility of another corporate-tax cut via the GOP sweep turbo charged the S&P 600 (+11%), regional banks (KRE +15%), speculative tech (ARKK +26%), and TSLA (+38%). The rotation and Mag 7 weakness led to a surprisingly small win for the Equal Weighted Average over the Cap Weighted measure.
Leadership Dynamics: Growth/Value/Cyclical

The median P/E ratio for SMID Value stocks is finally back to its 42-year average. This area of the market is still a relative bargain compared to everything else.
Small Cap Vs. Large Cap

Noting the five-percent monthly return gap between the S&P 600 (+11%) and the Equal Weighted S&P 500 (+6%), the expectation was that our Ratio of Ratios would jump out of its recent range. That was not the case, as both of the trailing P/E ratios soared a uniform 9% from October to November.
Baby Steps Higher

With the second month of Q3 reporting complete, the ratio of up-earnings to down-earnings was an improvement over the same period last quarter and the highest “two-month” figure in two years. Still, this vignette is hovering in the grey zone of results that aren’t deemed recessionary but are decidedly below average.
Back To Shrinkage In Q3
The S&P 500’s estimated bottom-up operating EPS was flat during the second month of Q3 results (Chart 1). With reporting essentially complete, the final Q3 figure will be roughly 1.5% below what was ultimately projected before the quarter’s announcements began. That’s a decent divergence from Q1 and Q2, which came in at 0.7% and 0.3% ahead of their respective “pre-reporting” estimates. The shrinkage in Q3 EPS is more in tune with long-term trends but also marks the end of a nice window of higher results—which is a rarity. Traditional EPS erosion is also evident in the snail trail for the anticipated outcome in Q4 .
The Russell 2000 & AANA
.png?fit=fillmax&w=222&bg=FFFFFF)
The most notable gainer in last week’s Trump Bump 2.0 was the Russell 2000. That index’s weekly surge of +8.6% was its best since the wild pandemic gyrations of April 2020. Yet, this latest Trump-associated upswing fell short of the Russell 2000’s election-week return of +10.2% in 2016 when Trump was the clear underdog.
Other Market Undercurrents

In October, the Mag 7’s combined contribution to the S&P 500 was 0%—neither adding to, nor detracting from the index’s -1% return. Since the end of June, a market-weighted basket of those seven names has produced +1.8%, while the cap-weighted S&P 500 is up 4.9%.
Leadership Dynamics: Growth/Value/Cyclical

At 43.8x, the median P/E ratio for our Royal Blue Growth segment is still 64% higher than its 1982-to-date average multiple of 26.7x. On the other hand, it is only 14% above its five-year average (38.4x).
Valuations: Small Cap Vs. Large Cap

Our Ratio of Ratios currently sits right at the moving average over the past one-, two-, and three-years. This vignette has, and continues to be frustratingly consistent in both its message and range. It’s also a perfect example that “valuation” is not a timing tool.
Perception for the Professional
March 2026 Issue

Featured Articles
Sector Navigator
March 2026 Issue
