Articles by Phil Segner Sr. Research Analyst & Co-Portfolio Manager
The Year Of AANA?

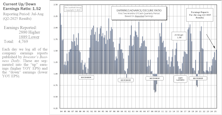
The return landscape has been good for a passive “own-everything” asset allocation policy. Our hypothetical “All Asset No Authority” (AANA) portfolio has seen a few more cylinders firing this year. In fact, YTD, none of AANA’s asset class constituents have negative performance.
Estimating the Downside - November 2025

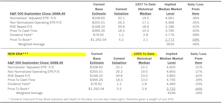
At the market trough back on April 8th, using history from 1995 forward, our downside-to-median calculation showed a potential loss of 13% for the S&P 500. Today, that risk measure sits at -34%, a contemporary extreme.
Spiking Q3 EPS

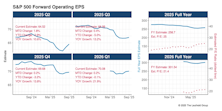
S&P 500 Q3 estimated bottom-up operating EPS shot 5% higher with results for the first month of reporting (Chart 1). This pop is much more impressive than the 2% gain we saw in July (after the first month of reporting for Q2). The current Q3 estimate of $70.27 is about a percent better than the last reading prior to the “Liberation Day” announcement. The tariff-induced bottom-line reckoning feared this spring has yet to materialize. We’d surmise that the still L-shaped EPS snail-trail for Q4 will bounce higher, too, come January.
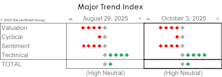
MTI: Driving In The Fog

Read the week's Major Trend.
Other Market Undercurrents
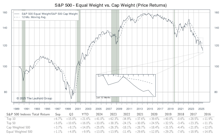
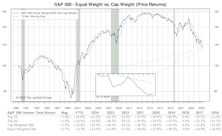
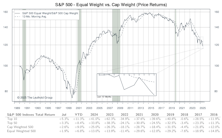
With the second and third quarters’ results in the books, 2025 is back to following the exact same playbook seen the past two years. The eight largest firms in the S&P 500 posted an average return of +50% since the end of Q1. That octet—now a 37% index weight—has contributed a little over two-thirds of the S&P 500’s +20% return during the last six months.
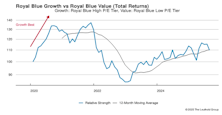
Leadership Dynamics: Growth/Value/Cyclical
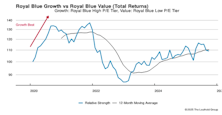
Russell 2000 Growth gained 26% since the end of March—the largest two-quarter bump for that index measured back to 2020. It fell just short of eclipsing its all-time high set in February 2021.
Valuations: Small Cap Vs. Large Cap
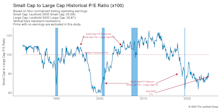
Small Caps have come alive the past two quarters with the Russell 2000 posting a 21% price increase. Why hasn’t our Ratio of Ratios turned higher (lower SC discount)? This vignette excludes firms with no earnings. Note that the higher-quality S&P 600 has gained 13% since the end of March.
Up/Down Earnings Above Average!
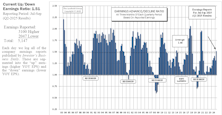
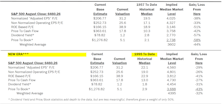
The Up/Down ratio reads 1.51. This is the first time the “three-month” tally has been above the vignette’s 41-year average since Q3-21 (15 quarters ago). Both the level and the momentum of this survey would suggest that an economic recession is not imminent.
MTI: Scrutinizing But Not Panicking
Read this week's Major Trend.
Estimating the Downside - October 2025
Make that “five” consecutive-monthly advances for the S&P 500. From the April 8th low through the end of September, the index has returned an eyepopping +35%.
Inflation: Cuts Coming With Core At 3%
.png?fit=fillmax&w=222&bg=FFFFFF)
CPI data from August was hottest since January but mostly inline with expectations. The market is looking for three rate cuts in the last three meetings of 2025. Tariff-related price increases are starting to show up but importers seem to be eating at least some of the costs.
Other Market Undercurrents
Trends in place since the April 9th tariff pause took a little break in August. Within the S&P 500: Value beat Growth, the Top-Ten Index lagged, the Momentum Factor Index underperformed, and High Dividend stocks surpassed all for the first time in four months.
Leadership Dynamics: Growth/Value/Cyclical
Small Value stocks (+9%) posted their best return since November 2024. Within our L3000 universe, this style box’s median P/E multiple is still well below its 43-year average.
Valuations: Small Cap Vs. Large Cap

The S&P 600 had its best month (+7%) relative to the Equal Weighted S&P 500 (+3%) since November 2024. Measured back to April, our Small Cap discount has shrunk from 26% to 19%.
Earnings Momentum Broadens Beyond Mega-Caps
The Up/Down ratio reads 1.52 and is the highest “two-month” tally since the beginning of 2022. Like our “one-month” figure from July’s reports, this observation is just slightly above the study’s 41-year average. Forward earnings for small- and mid-cap indexes are finally coming alive as well.
Estimating the Downside - September 2025
The S&P 500 notched its fourth consecutive monthly gain through August, advancing 2%. Over that span, our downside estimate for the index to return to its historical median level (1995-forward) widened from -24% to -32%.
Q2 Results Get More Impressive
The S&P 500’s Q2 estimated bottom-up operating EPS has now increased 4% since the start of reporting. This V-shaped recovery has erased the discount in earnings seen after “Liberation Day”; EPS estimates now stand even with those at the end of March. Despite the higher revisions for the current quarter, projections for the final two quarters of 2025 have only leveled off from their tariff-scare down-leg.
4% Club: NVDA Keeps Breaking Records
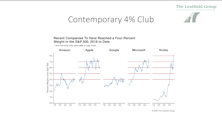
NVIDIA’s rise has reshaped the S&P 500 like never before. In just 18 months, the company has doubled its share of the index, hitting an unprecedented 8% weight. What does that mean for investors, for the balance of power among mega-caps, and for the old “4% Club” warning system? Phil Segner breaks it down in this episode of the Leuthold Podcast.
Leuthold Portfolios Update - July 2025

The cyclical sectors of Consumer Discretionary, Industrials, and Materials have climbed from the bottom of our sector rankings, three months ago, to now occupy the fourth, fifth, and sixth positions, respectively.
Other Market Undercurrents
NVDA’s 13% gain contributed just under half of the S&P 500’s +2.2% return for the month. The chipmaker ended July with an 8.1% index weight. Since 1990, there’s never been an 8% month-end weight from a single firm. The weight of NVDA and MSFT is equal to the combined weight of the smallest 332 firms in the S&P 500.
Perception for the Professional
March 2026 Issue

Featured Articles
Sector Navigator
March 2026 Issue
