Articles by Phil Segner Sr. Research Analyst & Co-Portfolio Manager
Additional Factors

The Magnificent Seven was trimmed to the Fab Four in Q1 as NVDA (+82%), META (+37%), AMZN (+19%), and MSFT (+12%) beat the overall S&P 500 and contributed just under half of the index’s total return for the quarter. We’ll score GOOGL a bogey (+8%), with AAPL (-11%) and TSLA (-29%) really making a mess of it. Heck, TSLA was the worst performing stock in the entire S&P 500 in Q1—nothing magnificent about that!
Growth vs Value vs Cyclicals

Mega Cap Growth’s excellent start to the year hit a snag in March: The Royal Blue Growth Tier was the only style box in the red. Outside of Small Caps, Growth and Value flavors returned similar results in Q1 (+8% to +10%).
Small Cap vs Mid Cap vs Large Cap
Our Ratio of Ratios is unchanged from last month, as both Large- and Small-Cap indices posted similar results in March. If earnings remain the same, Large and Small Caps, alike, would need to rise another 10% to match the contemporary, absolute P/E peak set at the end of 2021.
Two Years Underground

The Up/Down ratio is 1.14. Looking at the history of data, such a stretch of well-below-average readings should have either spiked higher on an economic upswing by now, or plunged even lower with a recession. The soft landing of 2015-16 posted four quarters of figures below 1.20—the current run has doubled that streak.
Estimating the Downside
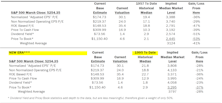
The S&P 500 recorded its fifth consecutive monthly gain in March (+3.1%). For the first quarter of 2024, the index returned +10.2%, not terribly far from the +11.2% seen in Q4 of 2023.
2024 Earnings & The Mag 7

Phil Segner digs into the earnings data on the latest Leuthold Podcast.
Inflation: A Bumpy Road To 2%
.png?fit=fillmax&w=222&bg=FFFFFF)
Like January, February’s CPI figures were hotter than expected. Stickier inflation data, spiking breakeven rates, and fewer Fed cuts haven’t scared the equity market one bit.
Additional Factors

If you happened to be in the business of producing or consuming A.I. chips (NVDA +60%, META +38%) you’ve done very well in 2024 thus far. Also, if one’s business model revolves around the negation of chips—potato or tortilla—this year has been very kind to you (LLY +29%). Those three firms, not necessarily the first names to come to mind to swing the index, have accounted for more than 40% of the S&P 500’s YTD upside.
Growth vs Value vs Cyclicals

Growth continued its fantastic start to the year with Royal Blue Growth +10% YTD. That gain has bolstered the median P/E multiple of this Mega-Cap proxy to 42x—near its contemporary high of 45x recorded at the end of 2021.
Small Cap vs Mid Cap vs Large Cap

In February, the S&P 500 outperformed the S&P 400 by 2%, helping to widen our Ratio of Ratios by a congruent amount. Currently, the meandering Small Cap discount sits right at both its one- and two-year moving averages.
From Abysmal To Awful

Our Up/Down ratio reads 1.06 for the second month of Q4 results. That is a vast improvement from the take-away-your-shoelaces “one-month” reading of 0.66. The current ratio lands toward the bottom of our depressing eight-quarter range of “two-month” figures.
Estimating the Downside - March 2024
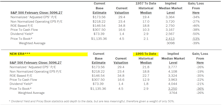
The S&P 500 posted its fourth consecutive monthly gain (+5.2%) in February. The index has advanced 22% since the end of October.
A Small Bump In EPS With Latest Q4 Reports
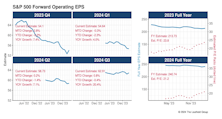
On its face, the second month of Q4 reporting was much more positive than the first. After sagging in January, the S&P 500 bottom-up EPS estimate rose back to $54—almost exactly where it stood before Q4 announcements got underway (Chart 1). With just a few stragglers left to report, full-year 2023 EPS will come in at $214. That’s almost 9% better than 2022’s final result.
NVDA - The Eighth Wonder of the World

Phil Segner examines Nvidia's meteoric rise to the four percent club and juxtaposes it with Cisco's dot-com bubble surge.
Additional Factors

The semiconductor stock is now within spitting distance of becoming the eighth firm ever to enter the prestigious 4% Club (achieving a 4% weight in the S&P 500). Over the last four years, NVDA has posted a return of +945%, pushing its index weight from 0.54% to 3.74%. The stock’s 24% gain in January contributed nearly half of the S&P 500’s +1.6% monthly return.
Growth vs Value vs Cyclicals

At the end of 2023, market breadth finally widened. That short run came to an end in January as the momentum champ of 2023—Large Cap Growth—was back in control.
Small Cap vs Mid Cap vs Large Cap

After a scorching December for the S&P 600 (+13%), the small cap index underperformed both the Equal- and Cap-Weighted S&P 500 in January. Interest rates—not valuations—seem to be in full control of the situation, as small caps patiently wait for rates to move lower.
Earnings Momentum

Our Up/Down ratio reads 0.66—a terrible start to Q4 reports; only five prior “one-month” readings were worse than today’s: Q2-2020 and every quarter of 2009. Despite present day economic conditions seemingly quite a bit different than in those five previous cases, roughly the same percentage of firms are failing to beat EPS of twelve months ago.
Estimating the Downside - February 2024

The S&P 500 reached new all-time highs in January and closed the month with a modest 1.6% gain. The advance in the numerator widened our downside-to-median estimates another tick.
Same Themes Continue In Q4
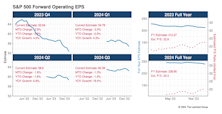
Well, it’s Groundhog’s Day Earnings Season… again. With the first month of results for Q4, operating earnings estimates for the S&P 500 continued their long slide from their optimistic highs set back in June of 2022 (Chart 1). The 20% drop in projected EPS didn’t stop the index from rallying +30% over those 19 months. Full-year 2023 operating EPS is now crystallizing around $210—a 7% gain from 2022’s results.
Perception for the Professional
March 2026 Issue

Featured Articles
Sector Navigator
March 2026 Issue
