Articles by Phil Segner Sr. Research Analyst & Co-Portfolio Manager
Q2—The EPS Slide Resumes
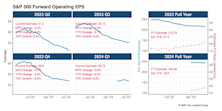
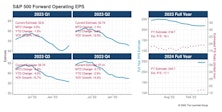
Q2-23 reporting is about halfway complete for firms in the S&P 500. Bottom-up operating EPS estimates for Q2 are once again sliding lower as we wade farther into earnings season. This attrition is not uncommon but it is certainly a break from Q1 announcements, where EPS estimates rose 5% over the course of reporting. Q1’s action was a bullish talking point for many who touted the end of higher-than-normal erosion in forward EPS estimates over the past year. Since peaking in April 2022 at $61.56, Q2’s EPS estimate has shrunk nearly 17% (Chart 1).
Midsummer Dreams & Nightmares Check In
We update our annual exercise for the mid-year, reviewing how the industry “Dreams” and “Nightmares” of the previous year have fared in the first half of this year.
Estimating the Downside - July 2023

June marked the third-consecutive quarterly gain for the S&P 500, with all the results remarkably similar: +7%, +7%, +8%. The index now sits at a level not seen since April 2022.
Additional Factors

Apple’s 9% gain in June helped it to become the first firm to reach a $3 trillion market valuation. For perspective, the combined market cap of the S&P 400 and S&P 600 is roughly $3.5 trillion. AAPL’s weight in the S&P 500 also reached a new high of 7.72%—which means it is a bigger slice of the index than the combined weight of the Materials, Real Estate, and Utilities sectors.
Growth vs. Value vs. Cyclicals

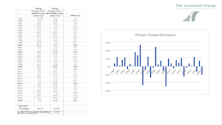
Like Q1, Growth dominated Value in Q2. The more exaggerated performance gaps were again in the larger market-cap tiers. Our Royal Blue Growth style box is up 22% YTD compared to Royal Blue Value’s +4%.
Small Cap vs. Mid Cap vs. Large Cap

Small Caps halted their three-month relative performance slide versus Large Caps, which boosted our ratio of ratios back to the twelve-month average.
Running Out Of Excuses

Our latest Up/Down ratio is 1.06. This “three-month” figure is a step back from Q4-22’s ratio of 1.19, and lands in the range of the abysmal readings from the first three quarters of 2022 (1.02-1.07). The current figure also doesn’t have the high look-back figures that 2022’s numbers had to overcome.
Inflation: Looks Like Late Innings
.jpg?fit=fillmax&w=222&bg=FFFFFF)
CPI readings for May were pretty much in-line with consensus estimates. Trends continue to play out as if we’re in the last few innings of rapid YOY price increases. Inflation and a deflating asset bubble have led to atrocious real returns across all asset classes.
Additional Factors

The top-five firms (AAPL, MSFT, AMZN, GOOG, NVDA) ended May comprising 24.2% of the S&P 500. This level of concentration eclipses August 2020’s pandemic high of 23.9%, and is the highest we have on record going back to 1990.
Growth vs. Value vs. Cyclicals

In the last three months, our Royal Blue Growth segment has outperformed Royal Blue Value by 14%, and all of our Value subsets ended May with YTD losses.
Small Cap vs. Mid Cap vs. Large Cap

We’re seeing some very choppy action in our Ratio of Ratios but feel confident in its trend and message. The narrowing in this month’s Small-Cap discount can be attributed to the sharp decline in our Large-Cap median P/E multiple, as the equal-weighted S&P 500 lost 4% in May.
Earnings Momentum - Still Flashing Recession

Our latest Up/Down ratio is 1.07. As we’ve mentioned in the past, the four previous periods in which the ratio dropped this low were all accompanied by recessions. However, the runways of poor figures leading to prior recessions has never been as long as the current one.
Estimating the Downside - June 2023

A late-month rally propelled the S&P 500 to a very modest gain for May. The last two months have been awfully quiet as far as volatility, with the index’s daily closing levels sitting in a range of just 149 points since the start of April—some kind of Spring doldrums, perhaps.
Unraveling Q1’s Twists
Earnings Almanac is a new research product where we dive into quarterly reporting for the S&P 500. The report is released the first week of the last two months of the calendar quarter.
Additional Factors

The index’s trading range spanned only 120 points in April—or a bit less than 3% of the previous month’s close. The S&P 500 has a monthly trading range average of a little over 9% since the start of the pandemic and, to find a month calmer than April, you’d have to go all the way back to July 2019.
Growth vs. Value vs. Cyclicals

Large Caps—both Growth and Value—were the only winners in April. The S&P 500 has outperformed the Russell 2000 by nearly 12% in just the last two months.
Small Cap vs. Mid Cap vs. Large Cap

Our Ratio of Ratios is kind of getting out of hand. The latest reading matches the March-2020 pandemic low. A recession—which only small caps seem to be priced for—will probably be needed to see a turning point in this relationship.
Earnings Momentum

Our latest Up/Down ratio is 1.17. Given the optimistic tone of the earnings season and lower hurdles of 2022, that reading is disappointing. This wide-view vignette is telling us that few firms are growing their EPS.
Estimating the Downside - May 2023

A late-month rally drove the S&P 500 into positive territory for April—the 1% gain pushed it to its highest monthly close in a year.
Additional Factors

AAPL (+12%), MSFT (+16%), GOOG (+15%), NVDA (+20%), and META (+21%) all posted tremendous results in March, while the average S&P 500 stock was down 1%. Those five mega-firms, representing 20% of the index weight, were responsible for 80% of last month’s gain and led to the largest monthly performance gap between Cap Weighted and Equal Weighted (4.6% spread) since March-2020, when the disparity was a 5.7% spread.
Perception for the Professional
March 2026 Issue

Featured Articles
Sector Navigator
March 2026 Issue
