Articles by Phil Segner Sr. Research Analyst & Co-Portfolio Manager
Earnings Momentum

With the final month of Q2-22 earnings complete, our Up/Down ratio reads 1.02. That is very close to the 1.05 ratio for Q1. Both readings fall below the vignette’s recession threshold of 1.07 (in the past 39 years, all readings below that mark were accompanied by an “official” economic recession).
Estimating the Downside

In September, the S&P 500 suffered its worst monthly loss (-9.3%) since the start of the pandemic.
#54 - Inflation Fever Not Broken
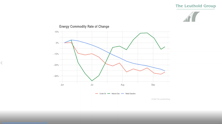
The CPI figures were hotter than expected and point to more Fed intervention. Barring a 2020 collapse in the price index, year-over-year figures are going to remain high for quite some time.
Inflation: Fever Not Broken
.jpg?fit=fillmax&w=222&bg=FFFFFF)
The CPI figures were hotter than expected and point to more Fed intervention. Barring a 2020 collapse in the price index, year-over-year figures are going to remain high for quite some time.
Additional Factors

The back end of August saw the S&P 500 give up about half of the 17% gain achieved from June’s closing low. The nine week bear-market bounce was fairly uniform across the major indexes: S&P 400 +19%, S&P 600 +19%, and the Nasdaq Composite +23%. Over the course of the bounce, impressive gains from AAPL +33%, AMZN +40%, and TSLA +44% accounted for roughly a fourth of the S&P 500’s advance.
Growth vs. Value vs. Cyclicals

After surging in July, our Royal Blue Growth segment (-6%) led all other style boxes in August. Since the end of November 2021: Royal Blue Growth = -28%, Royal Blue Value = +3%.
Small Cap vs. Mid Cap vs. Large Cap

Like puka necklaces and Ska music, Small Cap stocks are having a hard time coming back into favor. Our Ratio of Ratios has been below its median premium for almost four years. A near-term recession may push this relationship even lower, initially, but could provide a catalyst to return to a more “normal” figure.
Earnings Momentum

With the second month of Q2-22 earnings in the books, our Up/Down ratio is 1.04; levels this low have always been accompanied by an economic recession. It’s hard to make a case why this go-round would be any different.
Estimating the Downside - September 2022

It was a rough back half of August for the S&P 500 as it shed 8% in the final two weeks, overpowering the gains captured earlier in the month. In all, the S&P 500 had a loss of 4.2% for August.
Podcast #52 - More Shrinkage for EPS Estimates

Estimates are continuing to shrink for 2022 and 2023.
Additional Factors
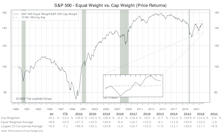
The six-week rally that started mid-June featured advances from AAPL (+25%), AMZN (+30%), and TSLA (+39%), which accounted for one-fourth of the S&P 500’s gain. Despite the recent preference for Value, a spike in interest rates, and the bear market, the index’s concentration in the top-five firms is still near it’s all-time high set in August 2020.
Growth vs. Value vs. Cyclicals

Growth stocks staged a modest rebound in July but still trail Value YTD, most notably in our Royal Blue segments. RB Value (-3.1%); RB Growth (-24.6%).
Small Cap vs. Mid Cap vs. Large Cap

Our Ratio of Ratio’s contemporary peak (Feb. 2021) of an 8% Small-Cap discount unsurprisingly coincided with a relative strength top in the Russell 2000. Over the ensuing 17 months, the Russell 2000 posted a 13% decline compared to an 11% advance for the S&P 500.
Earnings Momentum

With the first month of Q2-22 earnings in the books, our Up/Down ratio is 1.09. This figure lands in the fifth percentile of observations for our 39-year history and nearly matches the “one-month” reading of Q1.
Estimating the Downside - August 2022

Secular bear markets will drop far below median valuation levels. Today, if the S&P 500 sank to the 25th percentile (1957-to-date data), it would lose 41%.
Additional Factors

The first six months of 2022 have been unpleasant for risk indexes of every stripe. The S&P 500 (World’s Reserve Index) returned almost precisely -20% and its constituents lost $8.45 trillion in market value. Poof, gone. Similar first-half losses by the S&P 400 (-19.5%) and the S&P 600 (-18.9%) resulted in paper forfeitures for its member firms of “only” $518 billion and $221 billion, respectively.
Growth vs. Value vs. Cyclicals

The brutal first half for Growth stocks has valuations approaching their 40-year average, while Small Cap Growth continues to feature a steep discount to that.
Small Cap vs. Large Cap vs. Mid Cap

Our Ratio of Ratios ends Q2 with the largest Small Cap discount since May 2020. From the start of the year, on an absolute basis, the Large Cap P/E ratio moved from 28.7x to 22.0x; the Small Cap multiple declined to 16.2x from 21.6x.
Earnings Momentum

With the final month of Q1-22 earnings in the books, our Up/Down ratio is 1.05. We should note that this depressed level has preceded or accompanied every recession in our 39-year data set.
Estimating the Downside - July 2022

A downright awful performance quarter for the S&P 500 (-16.5%) has our downside-to-median estimates at their narrowest points since May 2020.
Perception for the Professional
March 2026 Issue

Featured Articles
Sector Navigator
March 2026 Issue
