Articles by Phil Segner Sr. Research Analyst & Co-Portfolio Manager
Growth vs. Value vs. Cyclicals

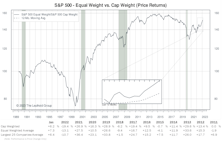
After a brutal 2022, Growth outdid Value in Q1 by a uniform 8% across all three market-cap tiers. That strength reopened the valuation gap between the two styles, which had been narrowing prior to March.
Small Cap vs. Mid Cap vs. Large Cap

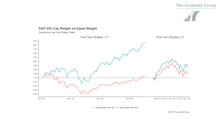
March’s huge Large-Cap outperformance sent our Ratio of Ratios tumbling to its lowest level since the start of the pandemic. Measured from the contemporary relative-strength peak of two years ago, the S&P 500 has a total return of +7% compared to -17% for the Russell 2000.
Earnings Growth Still Relatively Scarce

Our Up/Down ratio reads 1.19—Q4’s “three-month” result is somewhat higher than the range of the previous three quarters’ final numbers (1.02-1.07). Still, the current reading ranks in only the 22nd percentile of observations in our 39-year history.
Estimating the Downside - April 2023

The S&P 500 shrugged off a few bank failures and advanced 3.5% in March, ending the month above 4,100 for the first time since last July.
#63 - 2023 Earnings: Easy to Take the "Under"
.png?fit=fillmax&w=222&bg=FFFFFF)
Phil Segner digs into the earnings data on the latest Leuthold Podcast.
Inflation: Bank Run Edition
.jpg?fit=fillmax&w=222&bg=FFFFFF)
CPI readings for February were in-line with consensus estimates. Attention has been and will continue to be focused on banks and credit markets for investors and the Fed in the coming weeks. The Shelter Index made a fresh YOY high despite almost a year of declining YOY rent prices.
Additional Factors

As the market slumped in February, we saw more follow through from the three mega-cap dogs of 2022: TSLA, NVDA, and META all gained a uniform 18% for the month. Those three stocks, just 4.6% of the S&P 500’s weight, are responsible for nearly half of the index’s modest +3.7% YTD total return.
Growth vs. Value vs. Cyclicals

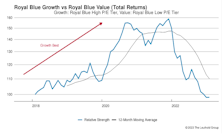
Within the Mid- and Small-Cap tiers, Growth seems to be forming a relative-strength bottom versus Value. However, in our Royal Blue space, where Growth peaked much later, no evidence of a bottom has yet developed.
Small Cap vs. Mid Cap vs. Large Cap

We’re now three years removed from the 2020 COVID market panic, when, over the course of four weeks, the S&P 500 and Russell 2000 lost 30% and 40%, respectively. That action sank our Ratio of Ratios to levels not seen since the height of the Tech Bubble. The Small-Cap discount, at present, is not too far removed from 2020 lows.
Whittled Down by Pinched Margins

Our Up/Down ratio reads 1.27. That is noticeably higher than the other three “two-month” figures of 2022, but still well below the historical average. Given the dour direction of reported- and estimated earnings, it’s a bit surprising that we’re seeing even a small pop in the results.
Estimating the Downside - March 2023

The S&P 500 sank 2.6% in February, meaning that the index has pretty much gone nowhere for the last six months.
Additional Factors
The S&P 500 had an almost biblical upheaval to start 2023. The “last were first” and the “first were last.” In January, the 100 worst performing stocks of 2022 had an average return of +16.1% while last year’s 100 best performers posted +1.7%.
Growth vs. Value vs. Cyclicals
Both Growth and Value Small-Cap style boxes gained 10% in January’s rally. However, SC Growth remains well in the rearview mirror since its relative strength peak in September 2020: Small Cap Growth +8% versus Small Cap Value +60%.
Small Cap vs. Mid Cap vs. Large Cap

In January, the Russell 2000 had its best month relative to the S&P 500 since last February. Another Small Cap head-fake? Or maybe the start of a fresh run, like September 2020-February 2021? (i.e., Russell 2000 +46%, S&P 500 +13%.)
Earnings Momentum

Our Up/Down ratio kicked off Q4 earnings season with a 1.57 reading. This “one-month” ratio is by far the highest of 2022, thus far. As usual, January reporting was very light, so don’t read too much into the numbers.
Estimating the Downside - February 2023

The S&P 500 bounced 6.2% in January, recovering nearly all of its December loss.
#61 - End of the 4% Club Golden Era
Phil Segner takes another look at the 4% club. For those of you not familiar with this vignette: back in the day, achieving a 4% weight in the S&P 500 had been a rare feat, occurring only during periods of extreme enthusiasm for technology, conglomerates or oil. The blessing of membership soon turned into a curse, with most taking just a cup of coffee behind the velvet ropes before being thrown to the curb because of dramatic underperformance to the rest of the Index.
#59 - “Dreams” And “Nightmares”
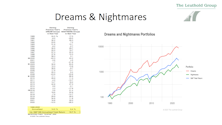
We update our annual exercise reviewing how the industry “Dreams” and “Nightmares” of the previous year (2021 in this case) fared in the ensuing year (2022), and conclude with the new year’s industry composition of the Dream and Nightmare portfolios based on 2022 performance.
Additional Factors

We wrap up 2022 with the S&P 500’s only positive performance quarter for the year—ending the longest quarterly losing streak (three quarters) since the Financial Crisis (six quarters). The year also drew some comparisons to the deflation of the Tech Bubble, as S&P 500 Value (-5%) demolished S&P 500 Growth (-29%) by the widest margin since Y2K.
Growth vs. Value vs. Cyclicals

At the end of November 2022, Royal Blue Value saw its largest twelve-month-rolling return gap (43%) over Royal Blue Growth since 2001.
Perception for the Professional
March 2026 Issue

Featured Articles
Sector Navigator
March 2026 Issue
