Articles by Phil Segner Sr. Research Analyst & Co-Portfolio Manager
Q2 Stumbling Out Of The Gates
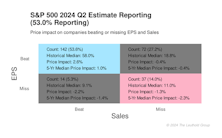
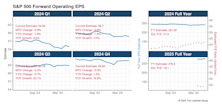
The S&P 500’s Q2 bottom-up estimated operating EPS sank 3% to $56.38 in the first month of reporting (Chart 1). This is a notable departure from the 2% rise we saw with the first month of Q1 results. One month is certainly not a trend but the most recent data brings some question into the above-average, no-erosion EPS estimates we have grown accustom to.
Sweet Dreams
In this episode of the Leuthold Podcast, Phil Segner provides a mid-year review of their "dreams" and "nightmares" portfolios for 2024 and finds some interesting results.
Additional Factors

The Equal Weighted S&P 500 has underperformed the Cap Weighted structure in 13 of the last 17 months. From May through June, the EW/CW performance gap was 6.3%. Since 1990, we’ve seen two consecutive months of worse EW relative performance just twice—both were in the throws of vicious bear markets: October-November 2008 (-6.6%), and February-March 2020 (-6.4%).
Growth vs Value vs Cyclicals

Our mega-cap proxy—Royal Blue Growth—was (once again) the only game in town for Q2. That size tier outperformed the others by 8-9% and was the lone subset on the positive side of the performance ledger.
Small Cap vs Mid Cap vs Large Cap

It took an ugly relative performance month (S&P 500 +4%, S&P 600 -2%) to break out of the 21%-27% twelve-month range for Small Cap discounts. The Small Cap value trap that began five years ago shows no signs of letting up.
Standing Taller
The Up/Down ratio reads 1.20—the best result for the last month of a quarterly reporting period since Q4-21. This figure towers over the last two years’ readings like Danny DeVito towers over a class of second graders. Tacking on other quarterly observations and you quickly see how “short” the contemporary Up/Down ratio has been.
Estimating the Downside - July 2024
The S&P 500 scored another win in June, adding 3.5%. The index has now gained 30% since the end of October.
Inflation: Good Times Are Here Again?
.png?fit=fillmax&w=222&bg=FFFFFF)
May’s CPI figures were cooler than expected, breaking a trend of generally hotter than anticipated results. Many inflation data series continue to plateau at rates higher the Fed’s comfort zone.
On The Wings Of NVDA

Nvidia’s +27% return in May means that this chip company now has a similar market cap and index weight as Microsoft and Apple (NVDA was less than one-fifth the size of AAPL just 18 months ago). In May, Nvidia contributed a little over one-quarter of the S&P 500’s return. For the first five months of 2024, the firm’s 121% gain has subsidized one-third of the index’s YTD performance.
Growth vs Value vs Cyclicals

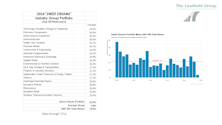
Our Leuthold Deep Cyclical group continues to have an excellent 2024. This basket of 30 economically sensitive names (NVDA happens to be one of them) is up 15% YTD.
Small Cap vs Mid Cap vs Large Cap

Our Small Cap discount has hardly budged this year, staying between 23%-26%. Looking at the best proxies for this vignette (the equal-weighted S&P 500 and the S&P 600), that range makes a lot of sense. Those two indexes are up 5.7% and 5.1%, respectively, through the first five months of 2024.
Better But Still Bad

The Up/Down ratio is 1.18. This is the best “two-month” figure since February 2023 (Q4-22 results) but still way below the long-term average. We’re still far from what we’d call pervasive YOY EPS growth.
Estimating the Downside - June 2024
The S&P 500 erased its April loss and set a fresh all-time high in May. Thanks to improved fundamentals, the weighted averages of these downside-to-median estimates sit just below their near-term highs of late March.
EPS Estimates Holding Up Well
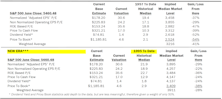
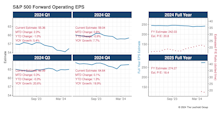
Q1 bottom-up operating EPS for the S&P 500 sank slightly to $54.94 after the second month of reporting. However, with reporting for the Index nearly complete, this figure is still 70 cents above the final pre-reporting estimate recorded at the end of March. The fifteen months of Q1 snail trail in Chart 1 shows remarkably consistent estimates, especially given our recent “ski slope” quarters of 2023. EPS estimates, at least in the aggregate, continue to hold up nicely for the other three quarters of 2024 reporting as well.
Additional Factors

One of the few bright spots for the index in April was Google’s post-earnings jump. The firm held on to most of those gains and ended the month with an 8% advance. This outstanding relative performance catapulted the company back into the 4% Club for the third time in its history. This also marks the first time that four companies have simultaneously shoehorned their way into the 4% Club.
Growth vs Value vs Cyclicals

Three of the last four years have offered some very divergent returns between the Growth and Value style boxes across all market caps—a 30% spread hasn’t been uncommon. Just over one-third of the way into 2024, there has been little variance between the two styles.
Small Cap vs Mid Cap vs Large Cap

It’s been a year since our Ratio of Ratios matched its pandemic-era maximum discount for Small Caps, at 36%. Since then, the relationship between the two multiples has gone decidedly nowhere, staying in the SC discount range of 22-28%.
Recession-Like Figures Continue

The Up/Down ratio is 1.02. This survey of firms, both large and small, continues to tell us that YOY EPS growth isn’t (and hasn’t been) pervasive—despite an economy that, in the aggregate, has remained remarkably resilient.
Estimating the Downside - May 2024
The S&P 500 snapped its five-month winning streak as it shed -4.1% in April.
Sales Beats Continue To Underwhelm
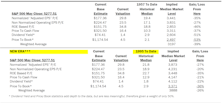
Q1 bottom-up S&P 500 operating EPS estimates jumped a little over a dollar to $55.36 after the first month of reporting. This halted the usual “slow-erosion” pattern that shaved $3 off the quarter’s estimate since last summer (Chart 1). The three forward quarters of 2024 also experienced a bump in estimates. S&P 500 full-year EPS projections now sit at $242. That would be a 13% YOY gain from 2023’s results.
Perception for the Professional
March 2026 Issue

Featured Articles
Sector Navigator
March 2026 Issue
