Articles by Phil Segner Sr. Research Analyst & Co-Portfolio Manager
Leadership Dynamics: Growth/Value/Cyclical

After Royal Blue Value’s huge relative win in March (+7%), Royal Blue Growth posted its best relative performance month since 2001, with a 10% advantage over Value.
Valuations: Small Cap Vs. Large Cap

Our Ratio of Ratios sits right on top of its one-, two-, and three-year moving averages. The Small Cap discount has been greater than 20% for all three of those periods. For years, we’ve said that a recession was probably needed to change this valuation dynamic. So far, the mounting prospect of a recession has only exacerbated Small Caps’ plight.
Losing Altitude

The Up/Down ratio reads 1.53, which is below average. This “one-month” print breaks a streak of four successively higher readings. For the last twenty years or so, our Up/Down ratio has been pretty consistent about either being in an improving cycle or a deteriorating cycle. Is the mini upswing over?
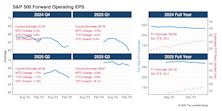
Q1 EPS Slide Arrested
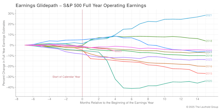
The S&P 500’s estimated bottom-up operating EPS nosed slightly higher during the first month of Q1 reporting. This is a welcome development following the steeper-than-usual decline over the past six months. Projections for the next three quarters of 2025 weren't as fortunate in April, as they all experienced a noticeably steep leg down of around 3%. The full-year 2025 operating EPS estimate for the index now sits at $260.72, down a conspicuous 4% since the beginning of the year.
Estimating the Downside - April 2025
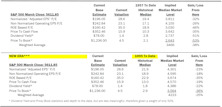
The S&P 500’s March loss was its worst since December 2022. The Q1 decline broke the index’s streak of five consecutive quarterly advances. Still, downside to median levels remains substantial: -38% based on 1957-to-date history; -25% using data from 1995-present.
Other Market Undercurrents

The Magnificent Malignant Seven posted an average return of -16% in Q1, with META (-2%) being the only firm not down double digits to start 2025. These plow horses of the past two years contributed all of the Q1 loss (and then some) for the Cap Weighted S&P 500 (-4.3%). Outside of the $2.8 trillion market-cap damage from those firms, the Equal Weighted S&P 500 was just about flat for Q1.
Leadership Dynamics: Growth/Value/Cyclical

Royal Blue Value, our mega-cap value proxy, was the only style box in positive territory for Q1, turning in an impressive 7% gain. Relative to RB Growth (-5%), RB Value had its best quarter since Q1-22.
Valuations: Small Cap Vs. Large Cap

Up markets or down markets, Small Caps have chronically underperformed Large Caps over the past three years. Why hasn’t the Ratio of Ratios continued to move farther south instead of sideways? Despite the relative weakness in the “P” for Small Caps, the shrinking “E” means the P/E ratio stays elevated.
A Year Of Improvement

The Up/Down ratio reads 1.41. This final figure for 2024 marks four consecutive quarters of improvement. Will the broadening earnings-growth story continue in 2025? Soft look-backs and momentum will have to overcome the renewed possibility of an economic recession.
Inflation: Stagflation Ahead?
.png?fit=fillmax&w=222&bg=FFFFFF)
February’s cool CPI figures were a welcome step down from January’s hot readings. Positive market reaction to the news was spotty. Trends that would suggest a cold economy and hot inflation are still in the early stages but uncertainty remains high.
Other Market Undercurrents

The Trump Bump may have peaked on February 19th with a post-election S&P 500 gain of 6.7%. By the end of the month, that had dwindled to +3.4%. The Russell 2000 has fared much worse, now down 4% since the November 5th close. Contrast that with 2016’s post-election surge where the S&P 500 was up 11.2% and the Russell 2000 gained 16.5% from election day through February 2017.
Leadership Dynamics: Growth/Value/Cyclical

Over the last year, returns between Growth and Value have been very similar within cap structures: Royal Blue Growth +14%, RB Value +17%: Mid-Cap Growth +15%, Mid-Cap Value +12%; Small-Cap Growth +6%, Small-Cap Value +8%.
Valuations: Small Cap Vs. Large Cap

Our Ratio of Ratios continues to be locked in a range as the preference for Large Caps persists. And who can blame the market? S&P 600 trailing EPS has shrunk 30% over the past three years compared with an EPS expansion of 10% for the S&P 500.
Earnings Momentum: Broader But Slower Growth

The Up/Down ratio reads 1.47—the best “two-month” figure since Q4-21 (1.54). This vignette seems to be telling us we’re finally experiencing a broadening in YOY EPS growth and an economic recession isn’t in the offing.
Estimating The Downside - March 2025
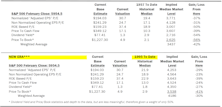
To return to median valuation levels, the S&P 500 would need to decline 42% (based on 1957-to-date historical figures).
Rough Reporting For The Mag Seven
The S&P 500’s bottom-up operating EPS continued to improve in the second month of reporting. Since the start of Q4 announcements, the EPS figure has increased 1%. The direction of the estimate, not necessary the amount, is what’s impressive. The same can’t be said for the coming two quarters, however. Bottom-up projections for Q1-25 have fallen 4% in the last two months, while Q2-25 is off 2%. Again, sharp moves higher in the EPS snail trails are exceedingly rare. With almost all of the reporting done for 2024, the S&P 500’s operating EPS of $234 equates to a healthy YOY gain of 9.5%. The expectation for full-year 2025 currently stands at +14.3%.
Other Market Undercurrents

On the last Monday in January, China’s newest and seemingly wildly efficient AI assistant, DeepSeek, begged the question, “Maybe we don’t need all of these chips to run AI?” That day, Nvidia and Broadcom each cratered -17%, the largest daily loss for both since the March 2020 panic. Recall that those two firms provided a little over a quarter of the S&P 500’s +25% return in 2024.
Leadership Dynamics: Growth/Value/Cyclical

Mid-Cap Growth (+6.4%) was the best performing style box of January. Since the end of September, MC Growth has outperformed MC Value, +15% versus +2%, respectively. Style leadership now seems to be evident in the Mid-Cap space but it’s still ambiguous among Large and Small Caps.
Valuations: Small Cap Vs. Large Cap

After an initial post-election surge, hopes of a small-cap Trump bump seem to be fading. Since election day through the end of January, the Equal Weighted S&P 500 (+1.9%) has essentially matched the S&P 600 (+2.1%).
Up/Down Earnings: Best Tally In Three Years

The Up/Down ratio reads 1.68—the highest “one-month” figure since way back in January 2022. Out of the depths of recessionary-like numbers just four quarters ago, the ratio continues to rise and is now approaching its 42-year average.
Perception for the Professional
March 2026 Issue

Featured Articles
Sector Navigator
March 2026 Issue
