Articles by Phil Segner Sr. Research Analyst & Co-Portfolio Manager
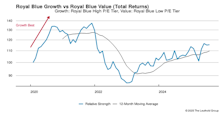
Leadership Dynamics: Growth/Value/Cyclical
Our Deep Cyclical Group has been on a tear over the past three months, rising 18%. The S&P 500 High Beta Index has done even better, with a 30% gain over that time.
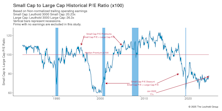
Valuations: Small Cap Vs. Large Cap
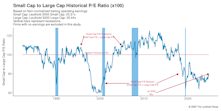
This is the narrowest discount the vignette has registered in three-and-a-half years, although we’re not far off the 25% average discount for the period.
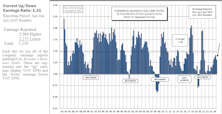
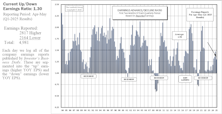
Above Average!
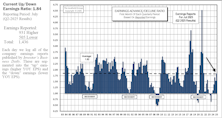
The Up/Down ratio reads 1.84. This figure is above our 41-year average of 1.82 for the first time since January 2022. That gap of 13 quarters between above average “one-month” readings matches the longest previous streak, which was the lead-up to and during the depths of the Financial Crisis.
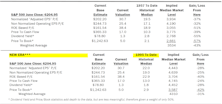
Estimating the Downside - August 2025
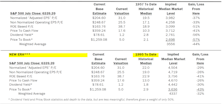
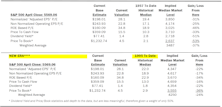
The S&P 500’s potential downside to its 1957-to-date median is -44%, and its normalized P/E ratio of over 30x continues to be a concern. However, we can only cry “wolf” so many times… 11 of the past 14 month-end measures have been above that threshold.
Lowered Bar Cleared Easily
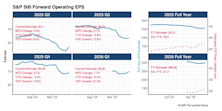
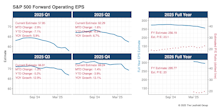
The S&P 500’s Q2 estimated bottom-up operating EPS shot 2% higher after the first month of reporting. This recovery effectively negates some of the earnings markdown associated with trade uncertainty in the months leading up to this reporting season. The EPS snail trails for the coming three quarters also leveled out or have even turned higher.
Tobacco Is King?
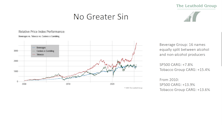
Imagine the best-performing industry group out of 119 since late 2023. Was it a red-hot tech stock? A booming financial giant? Think again. It was in the stone-cold consumer staple sector: tobacco, which has surged almost 90% through this period!
Other Market Undercurrents
As the market dismissed wild trade-policy uncertainty and the U.S. lobbing missiles at Iran, the index posted a tidy +11% for Q2 (following a Q1 loss of 4%). A little over half of the S&P 500’s return of the last three months was contributed by inspired performance from Microsoft (+33%), Nvidia (+46%), and Broadcom (+65%).
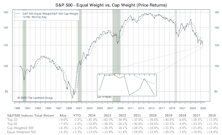
Leadership Dynamics: Growth/Value/Cyclical
Value in Q1, Growth in Q2.
Valuations: Small Cap Vs. Large Cap
For the first time since November 2024, the Russell 2000 posted a better monthly return than the S&P 500! The excellent Q2 results for each segment have pushed up their absolute valuations, but both are still well short of their contemporary highs.
A Step Back
The Up/Down ratio reads 1.31—below average. The first quarter’s earnings reports failed to build on 2024’s broadening, but still modest EPS growth story. A reversion to the awful figures of 2022 and 2023 is not guaranteed, although trends in this data have been quite binary, especially over the last ten years.
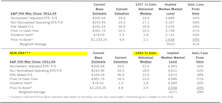
Estimating the Downside - July 2025
The S&P 500 continued its surge following the tariff scare—up 25% from the close on April 8th through the end of June. Based on history from 1957 to date, the index’s potential downside to median levels has deepened to -43% (vs. -41% as of May 31st).
Estimating the Downside - June 2025
The S&P 500 is back within spitting distance of its all-time high, and, as one would guess, our downside calculations are stretched almost to their contemporary extremes.
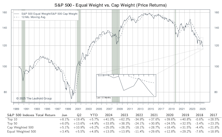
Other Market Undercurrents
The 19% surge from the closing low on April 8th, through May, has been fueled by the largest firms. Out of the Mag 7 names, only Apple (+17%) underperformed the overall index; the average gain among the other six registers at +33%. Let’s not forget, it was these very names that led the S&P 500 lower—and the equal-weighted Mag 7 basket is still down 5% YTD.
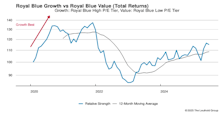
Leadership Dynamics: Growth/Value/Cyclical
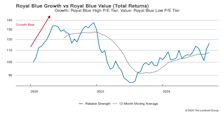
In the Large- and Mid-Cap spaces, Growth’s two-month surge erased Value’s YTD advantage. Since the end of March, RB Growth: +11%; RB Value: -3%; MC Growth: +13%; MC Value: +2%.
Stuck in Neutral
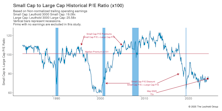
Our Ratio of Ratios continues to go nowhere, as six of the past seven months registered a Small-Cap discount of either 25% or 26%. Large-Cap outperformance and a worsening Small-Cap earnings profile seem to have balanced out overall relationship.
Earnings Falter Despite Low Hurdles
The Up/Down ratio reads 1.30—below average. This “two-month” print breaks a streak of four successively higher readings, and is even more disappointing given that last year’s look-back comparison for this “two-month” period was very weak (1.18).
Slowing Sales, Fat Margins
The S&P 500’s estimated bottom-up operating EPS for Q1 lost altitude during the second month of reporting. (Chart 1). That resumes the rounded downslope of estimated EPS erosion for the quarter that seems foreign (though normal) after the resiliency of the 2024 data. The next three quarters of 2025—periods that will be affected by the trade war—continued their post tariff decline. The waning projections still have the index inline for 10% YOY EPS growth. At this point in the game, 5% growth is probably a stretch.
Inflation: No Tariff Shock Yet
.png?fit=fillmax&w=222&bg=FFFFFF)
April’s cooler than expected CPI figures continued the recent trend of soft readings—welcome news to the Fed. Tariff related price spikes were not pervasive in the first few weeks of the shifting trade policy landscape.
Estimating the Downside - May 2025
A wild April ended almost exactly where it started for the S&P 500, leaving our downside estimates pretty much unchanged. A decline to median levels (1957-date) would put the S&P 500 at 3,487 (a 37% loss).
Other Market Undercurrents

In early April, the popularity search for “NYSE circuit-breaker levels” spiked. The S&P 500 came within a whisker of an official bear market. Then, following a Presidential tweet to buy, the largest daily gain since October 2008 came along. By the end of the month, the index was riding its longest daily winning streak since November 2004. All of that turmoil and heartburn led to a -0.7% month-over-month change for the S&P 500.
Perception for the Professional
March 2026 Issue

Featured Articles
Sector Navigator
March 2026 Issue
