Articles by Phil Segner Sr. Research Analyst & Co-Portfolio Manager
Up/Down Earnings: Better, Not Great

The Up/Down ratio reads 1.38—the highest “one-month” figure of the last two years but still below average. More importantly, the ratio has finally broken out of the range that has historically been identified as recessionary.
Estimating The Downside - November 2024
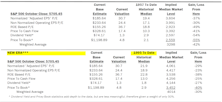
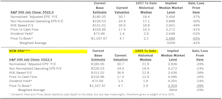
A Halloween loss of nearly 2% snapped the S&P 500’s five-month win streak. October’s loss, however, did little to ease the downside-to-median risk.
Double Beats Rare In Q3
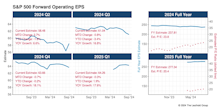
The S&P 500’s estimated bottom-up operating EPS shrank 2% during the first month of Q3 reporting (Chart 1). A similar, slightly larger drop in the EPS estimate was experienced in July, as results were tallied for Q2’s first month of reporting. That initial Q2 deficit was recouped over the next two months and actual results eventually ended higher than what was projected at the beginning of earnings season. To maintain this year’s strong earnings streak, where results match estimates (not common), we’ll need another “spring-back” scenario at the back end of Q3.
Other Market Undercurrents

The index ended September with its fifth-consecutive monthly gain and fourth-consecutive quarterly advance. Ten of the last eleven months have been positive, resulting in a 37.4% price gain. A window like this doesn’t come around very often—since the Y2K bubble, the only two runs that can top today’s are the eleven-month periods ending January 2010 (+46%) and February 2021 (+48%).
Leadership Dynamics: Growth/Value/Cyclical

Both Mid- and Small-Cap Value advanced 10% in Q3, easily outpacing all the other style boxes. Yet, since these two segments have been such laggards in this cycle, they’re still the only pockets in our universe with median P/E multiples below their 1982-to-present average.
Large Cap vs Mid Cap vs Small Cap

Our Ratio of Ratios now sits at the widest Small Cap discount of the last 18 months. The Small Cap advantage generated in July was gradually undone in August and September, with the S&P 400 and Equal Weighted S&P 500 (the best proxies for this study) both ending Q3 with 9% gains.
Earnings Momentum - Positive Direction

The Up/Down ratio reads 1.32—the best quarter-end figure since Q4-21. More firms outside of the mega-cap space seem to be participating in the EPS-growth story for the first time in two-and-a-half years.
Estimating the Downside - October 2024
The S&P 500 shot up 5.5% in Q3 and marked the seventh advance of the last eight quarters. During this two-year period, the index has posted a total return of +66%.
Inflation: Let The Cuts Begin
.png?fit=fillmax&w=222&bg=FFFFFF)
August’s Core CPI was a tad hotter than expected, locking in a 25bps cut a week from today. Markets currently forecast 250bps of Fed easing by the end of 2025. We probably won’t see sub-2% inflation rates until the Spring of 2025.
Other Market Undercurrents

Seven of eleven underlying sectors outperformed the overall index in August (+4.5% versus +2.3%, respectively). However, those seven subsets make up just 48% of the S&P 500. The +1% returns contributed by Info Tech and Communication Services (which comprise 39% of the S&P 500) highlight just how much the index depends on those two tranches of firms.
Growth vs Value vs Cyclicals

Royal Blue Growth (+4%) was our best performing style box in August. That gain has pushed this large-growth proxy’s median P/E ratio to 42.8x—the most extreme observation since the contemporary peak of 45.0x set in December 2021.
Small Cap vs Mid Cap vs Large Cap

The Small Cap discount widened once again, as the long-running theme of Large Cap leadership over Small Caps resumed in August. The S&P 600 SmallCap index lost 2%, while the Equal Weighted S&P 500 gained 2%.
Earnings Momentum - Surprise Bump

The Up/Down ratio reads 1.32—this is the highest “two-month” figure we’ve seen over the last two-and-a-half miserable years. The 3,600 firms reporting in August had a standalone ratio of 1.40—which is, historically, a decent level of higher YOY EPS.
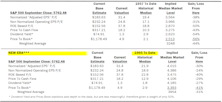
Estimating the Downside - September 2024
The S&P 500’s August gain was its ninth advance in the last ten months. If the index were to retreat to its median level based on data from 1957 forward, the estimated loss is now 43%.
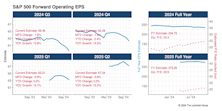
Q2 Bounce Back To Trend
The S&P 500’s estimated bottom-up operating EPS rebounded 4% to $58.48 in the second month of results (Chart 1). With Q2 reporting essentially complete, EPS is now slightly above where it stood before reporting began. After the sharp dip during the first month of Q2 earnings announcements, we’ve resumed the recent and very positive “no-erosion” trend in aggregate EPS.
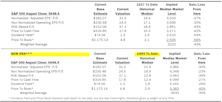
Estimating the Downside - August 2024
A second push on July 31st propelled the S&P 500 to another positive month (+1%). Now, if the S&P 500 fell to the 25th percentile (1957-date), it would lose 50%. Using the history since 1995, the downside is 35%.
Mag 7 Haircut

Confidence was shaken in the bulletproof Mag 7 as only Tesla and Apple (the YTD laggards of the esteemed group) escaped what was otherwise a fairly uniform 5-6% haircut. Those seven magic names shaved 70 bps off the S&P 500’s narrow monthly advance (but still account for half of the index’s YTD performance).
Growth vs Value vs Cyclical

Russell 2000 Value gained 12.2% for July and was easily the best performing style box. As we move into August, YTD results across all style boxes look much more uniform.
Small Cap vs Mid Cap vs Large Cap

The S&P 600 (+10.7%) outperformed the Equal Weighted S&P 500 (+4.4%) in July—the widest margin in three-and-a-half years (these two indexes are the best proxies for this vignette). Our Ratio of Ratios, in turn, shrank by a similar margin.
The Slump Continues
The Up/Down ratio reads 1.13—this marks the 10th consecutive quarter of below-average “one-month” results, with eight of those coming in at a level previously reserved only for economic recessions (including the current reading).
Perception for the Professional
March 2026 Issue

Featured Articles
Sector Navigator
March 2026 Issue
