S&P 500
3% Yields Proved To Be High Enough

In September the popular claim was that “interest rates were rising for the right reasons,” and still too low to threaten stocks or U.S. economic expansion.
Assessing The Damage
.jpg?fit=fillmax&w=222&bg=FFFFFF)
Our tactical accounts remain positioned very defensively, and we have yet to see the sort of capitulative market action that would lead us to lift any existing equity hedges.
Estimating The Downside: The G-Rated Version
The longevity of this bull market is impacting tactical asset allocators in ways great and small.
S&P 500—Valuation Check-Up

In late January we speculated how long it would take for the S&P 500’s bloated valuations to reach more reasonable levels. The S&P 500 now trades back where it was in January and the seven-month break included some of the best growth rates most have ever seen. We found ourselves asking: Did chubby Mr. Market shed any pounds as he pedaled away on his stationary bike?
Breakout Or Fake-Out?
The S&P 500 has fully erased its January and February losses, but there’s probably a market message in the fact that it took so long to do so.
Beware The Breakout

The S&P 500 finally erased the losses from its nine-day swoon in January and February.
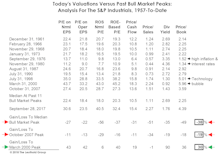
Assessing The Correction
How do today’s cyclical conditions stack up with those accompanying other stock market declines?
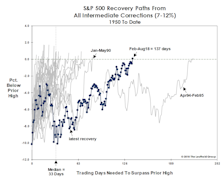
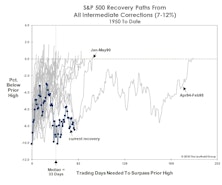
A Launching Pad??
A few clients pointed out that the longest-ever recovery from an intermediate correction (Apr. 1994–Feb. 1995) became the base from which the S&P 500 would eventually triple over the next five years. We’re not equipped to address that possibility in an objective fashion, so we’ll let you be the judge.
No, It’s Not Y2K Again…But The Lights Could Still Go Out
.jpg?fit=fillmax&w=222&bg=FFFFFF)
For the last year, we have labeled the S&P 500 Price/Sales ratio—which has returned to its Y2K bubble levels—the “scariest chart in our database” (Chart 1). Recall that the initial visit to present levels was followed by the S&P 500’s first-ever negative total return decade.
How The S&P 500 Could Hit 2,500… Ten Years Out
.jpg?fit=fillmax&w=222&bg=FFFFFF)
Yesterday was the six-month anniversary of the S&P 500 bull market high, and the index celebrated the event by nearly setting a new peak. Meanwhile, the S&P 500 Total Return Index did make a new high on Wednesday.
Multiple Personality Disorder?

Market behavior is always nebulous enough to generate diverging opinions, but lately it’s been sufficiently strange to give rise to a diverging set of facts.
Full Employment And Rising Prices Aren’t Stock-Friendly
.jpg?fit=fillmax&w=222&bg=FFFFFF)
Annual Producer Price Inflation rose to 4.0% in May, a key threshold above which the S&P 500 has historically delivered essentially flat returns. But the fact that this reading occurs against a backdrop of full employment is cause for even more concern. Context is key...
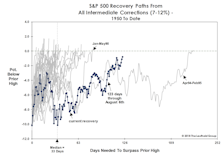
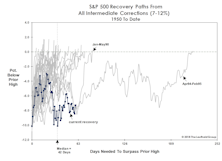
Is The Bull Just Napping?
Old age has certainly put no limitations on the bull’s exploits, so we should be cautious in reading too much into its meandering recovery path. However, it’s possible that action since the February low is not a recovery process but rather a countertrend bounce within a larger downtrend.
If You Think This Market’s Fishy, You’re Right

Tomorrow is the Minnesota season-opener for muskies, but the fanatics who chase them are likely disappointed that it comes a few days after an event that’s known to trigger these beasts: the full moon. The screenshot is from our $9.95 “iSolunar” iPhone app, and shows that Saturday merits only a “three fish” day (out of a possible “four fish”)—based on the moon’s fading illumination.
A New Hurdle For An Old Bull?

The first quarter S&P 500 earnings “beat” rate stands to be the highest in history, as any CEO with a pulse has learned to lower the hurdle.
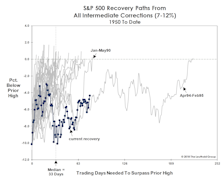
The “Correction” Clock Is Ticking
2018’s S&P 500 setback qualifies as an “intermediate” correction. Historically, the duration of intermediate corrections is brief, and recovery time to move back above prior highs has also been brief. This year’s retracement route is already among the most meandering of all recovery paths since 1950.
Market Corrections And The Hazards Of Old Age
In difficult markets, we have become more appreciative of some of life’s small gifts. For example, it’s been quite a while since we’ve heard it argued that this is “the most hated bull market of all time.”
Musings On Margins
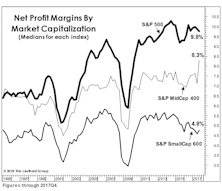
Fourth quarter earnings were the last ones to be burdened by a 35% top marginal corporate income tax rate, and therefore seem to have been given a pass by the analyst community.
Assessing The Selling
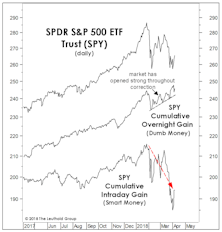
While the January 26th bull market high illustrated none of the hallmarks of a major cyclical top, there are secondary signs that a stealthy distribution process may be underway, such as an overwhelming bias toward opening market strength followed by intraday weakness.
Mid-Term Mayhem?

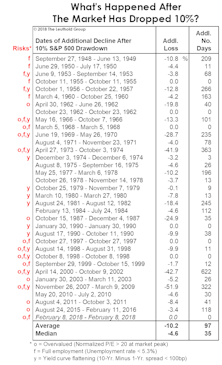
The prospect of a mid-term congressional shake-up may rattle the markets in 2018. Since 1962, nine major bear market lows occurred during mid-term election years, with eight of those happening during the traditionally weak months of May through October.
Perception for the Professional
March 2026 Issue

Featured Articles
Sector Navigator
March 2026 Issue
