S&P 500
Beware The Deceptive S&P…
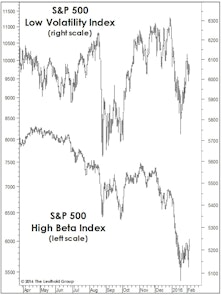
At its January 20th closing low, the S&P 500’s peak-to-trough decline of –12.7% barely met our definition of a severe market correction (an S&P 500 loss of 12% to 18%). But the behavior of this particular index can be quite sinister during the final phase of a bull market—and during much of the ensuing bear.
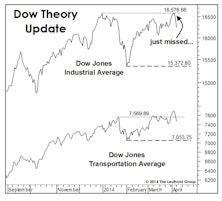
A Milestone You Might Have Missed
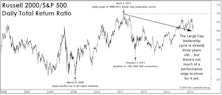
The fifth anniversary of the bull market was met with fanfare, but the launch of the Large Cap leadership cycle in April 2011 is receiving no attention whatsoever.
U.S. Markets See Uniform Strength, While The World Seems Fractured
Based on the historical percentages, the bull market should have a minimum of four to six months of life left. But the market has a way of throwing sand in the gears when you think you’ve begun to understand its internal mechanics.
Profit Margins At The Sector Level
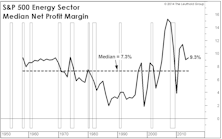
All ten of the S&P 500 sectors recorded a sequential increase in four-quarter trailing net profit margins. But consider where sector margins stand today relative to their 25-year medians. Eight of ten S&P 500 sectors are recording profit margins well above their long-term medians.
Another Kind Of Decoupling?
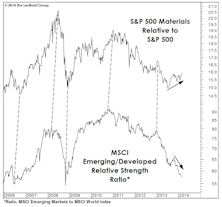
We’ve discussed the interrelationships between industrial commodities, commodity-oriented equities and Emerging Market stocks. Getting one’s bet right on any of these three has generally led to profitable positions in all three. But that certainly hasn’t been true in recent months.
Valuation: Today Versus The Late 1990s

We “mapped” current readings on six time-tested valuation ratios to the month in which those readings were first matched or exceeded as the late 1990s market bubble developed.
The Bull Market Turns Five

The post-2009 stock market upswing now qualifies as only the sixth cyclical bull market since 1900 to last five years or more. But only three of the previous five-year-old bulls lived to see a sixth birthday.
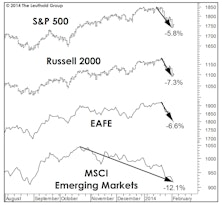
Anatomy Of A Correction

While the current market setback of –5.8% doesn’t qualify as an intermediate correction, it’s close enough to the threshold to warrant a quick review of what such a correction—and the ensuing recovery—might look like.
Too Early For The Top?
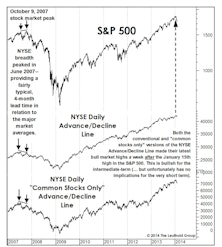
January’s new breadth highs suggest new bull market price highs are likely some time in the next several months… but they can’t rule out a painful February.
Polar Vortex Hits The Markets Too
The stock market kicked off 2014 with a (so far) shallow bout of weakness which we don’t consider to be the start of a new cyclical bear market or even a deep correction.
Secular Bull Or Bear?

Is a new secular bull market underway? New highs in essentially all U.S. undermine the argument from the shrinking pool of secular bears. But new converts to the bull thesis should be concerned about the valuation levels already reached.
Sector Performance – Finding Discrepancies
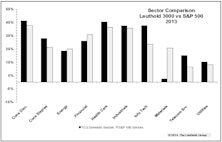
Our Tech sector outpaced the S&P 500 Tech sector by 1400 bps and our Materials sector lagged the S&P 500 Materials by 2300 bps. Here’s why…
Correlations Staying Steady

The decrease in correlations has been helpful for investors, but the lack of volatility in the measure has arguably been more important.
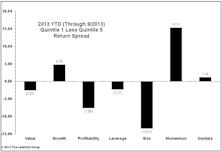
Buy The Bridesmaid, Not The One Looking To Rebound
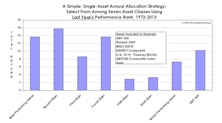
The investment leadership of a given year has historically had better-than-even odds of outperforming in the following year at both the asset class and equity sector levels.
Stock Market Leadership In 2014: Large Caps, Tech, Health Care
Following a great year for trend-following, capitalizing on key reversals in sector performance will be important in winning the 2014 performance derby.
2014 Time Cycle—Lower Your Expectations & Be Patient
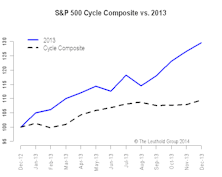
It’s time to update our time cycle composites, and what they say for equities in the U.S., U.K., Germany and Japan and long-term interest rates and credit spreads in the U.S.
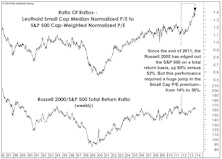
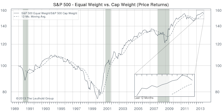
S&P 500: Cap Weighted Outperforms For The Second Month In A Row
During November the Cap Weighted S&P 500 (+2.8%) outperformed the S&P 500 Equal Weighted (+2.1%) for a second consecutive month.
S&P 500: Cap Weighted Outperforms During October
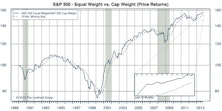
The Cap Weighted S&P 500 (+4.5%) slightly outperformed the S&P 500 Equal Weighted (+4.2%) during October. YTD, the spread between these two indices remains wide, with the Equal Weighted index outperforming by 4.2%.
No “Pop,” Just A “Hiss”…
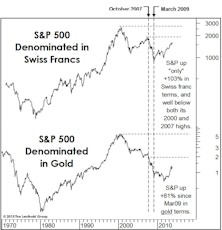
In the 1970s, a cassette tape manufacturer asked listeners, “Is it live, or is it Memorex?” Forty years later, watchers of the stock market “tape” find themselves asking, “Is it real, or is it QE?”
Perception for the Professional
March 2026 Issue

Featured Articles
Sector Navigator
March 2026 Issue
