S&P 500
Momentum Drive Returns; Correlations Increase

The worst performers are the first sell candidates for investors looking to shed assets.
Tuning Up The Printing Presses?

What were QE2 and Operation Twist intended for if not to save Europe?
Three In A Row And Counting...

Is there an historical precedent for important stock market highs to occur in the same month for three or more consecutive years? YES. In 1938-1942 the S&P 500 registered key highs during the first two weeks of January for five straight years.
Down Ten Percent...In A "Better Than Average" Year?

While this is not our forecast, some investors will no doubt be mortified to learn that a “typical” calendar year (again, if there were such a thing) contains a drawdown as large as –13.5%.
VLT And Foreign Markets

Exploring VLT (Very Long Term) Momentum readings in foreign markets versus the S&P 500.
No Place Like Home
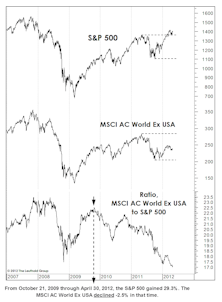
How is the U.S. stacking up relative to foreign markets since 2009 market lows?
Trying To Forget May 2011 (...and May 2010)

Trying to forget the April tops of the past two years appears to be difficult for many as sentiment measures remain relatively dismal (which is a stock market positive). What insight can we gain from this?
More On Mean Reversion

Could it be possible we’re on the doorstep of another great secular run in stocks? Well… no.
Is Apple Forever?
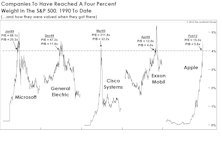
Apple now comprises 4.4% of the S&P 500, making it the fifth entrant into the Four Percent Club since 1990.
Stay Bullish

It’s April once again… Are we due for yet another market top? Some perspectives on the possibility of attaining a new all-time market high in the current cyclical bull, and what may drive the upside.
Apple: Just How High Can It Go?

A discussion on mounting Apple insanity and an old study revisited focusing on long term corporate survivorship— “Is Apple Forever?”
Expecting A Little March Madness

Things seem calm on the surface… is a little March Madness in store?
Looking Deeper Into The Tails Of Distribution
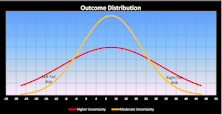
Leuthold’s Eric Weigel examines both positive and negative tail risk among asset classes over two time periods… the recent volatile era versus a preceding, not-as-volatile time period.
2011 Volatility Summary: S&P 500 And NASDAQ
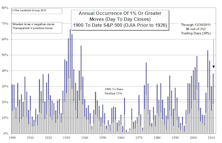
Even though the major indices ended the year flat for the most part, volatility measures paint a different story.
Risk Premium for Stocks Making a Comeback…

Andy Engel revisits our Stock/Bond Performance Differential study which examines rolling stock/bond spreads over various time periods and subsequent asset class returns. It appears that trends are finally reverting slowly toward the norm.
Market Worrying You? Just Sleep On It!

A rather surprising discovery when comparing intraday versus overnight market price action, and perhaps a “Smart Money” buy signal revealed as well?
Worse Than It Looks… And Not Over
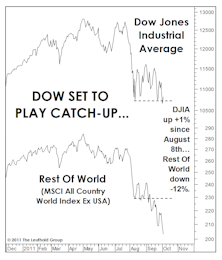
Most costly market decoy in the last six weeks has been unusual (relative) strength of the Dow and S&P 500 indexes. Resilience in blue chips is characteristic of the early and middle phases of a bear market, but recent blue chip performance has been so stellar (again, in a relative sense) that most investors curled up comfortably in the “correction” camp…while small caps, cyclicals and virtually all foreign markets were screaming “BEAR!”
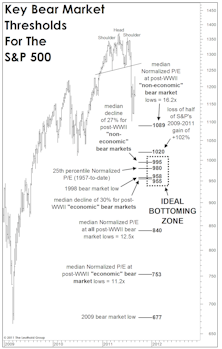
Bear Market Facts—A Refresher
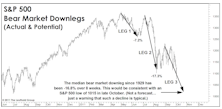
This month’s “Of Special Interest” examines the bear market facts. Doug Ramsey doesn’t expect the current bear market to reach historical bear market medians in terms of decline or duration. Non-economic bear markets are usually much shorter than recession-induced bears.
Golden Milestone
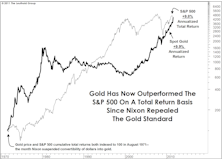
The yellow metal itself celebrated 40 years of “independence” by pulling ahead of the S&P 500 on a cumulative, total return basis since the gold window was closed.
Another Swoon Coming
Several U.S. indexes and world stock markets have already lost 20% or more from recent peaks, satisfying the parameter for a bear market.
Perception for the Professional
March 2026 Issue

Featured Articles
Sector Navigator
March 2026 Issue
