S&P 500
Keep An Eye On This Spread

For years, the Cabot Market Letter has tracked a “Two-Second Indicator” that’s based on the number of NYSE New 52-Week Lows.
How To (Almost) Double Your Money In Under Ten Years
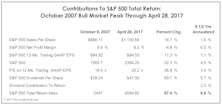
Buying the S&P 500 on one of the worst possible days in history ultimately yielded a total return of +87.4% (+6.8% annualized) through the end of April 2017...darn, sounds like an advert for Vanguard!
Spring Forward, Fall Back?
The S&P 500 has gained about 5% on the year, respectable but hardly consistent with the “melt up” scenario we thought might occur.
Much Ado About Not Very Much

In February, NYSE Margin Debt finally edged above its prior record established in April 2015, a certain sign—according to many bears—that stock market speculation has reached a fever pitch.
What If You Bought "The" Top?

Given the flood of assets into passive equity mutual funds, it’s a mathematical certainty that some unlucky investor will make his or her first purchase of the SPDR S&P 500 Trust on the exact day of the eventual bull market high.
Could Inflation Threaten The Stock Market?
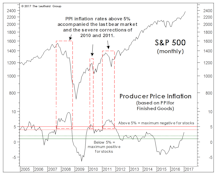
Over the last 70 years, stocks have made no cumulative progress when Producer Price Inflation runs above 4%. Returns have been average when PPI inflation runs between 2% and 4%—where it is today.
Estimating The Upside: Another Angle

A look at the potential upside for the median S&P 500 stock, based on the theory that each of four valuation ratios reaches its individual all-time high set during the last phase of the 1990s’ market mania.
Another Take On High Valuations

While stock market valuations are high, they are still considerably below their Technology bubble peak of March 2000. We’ve therefore conceded that there’s still room for a true market melt-up as long as cyclical conditions remain positive.
Apologizing in Advance for Trump

While Wall Street is extremely well represented in the new administration, we doubt that Wall Street’s performance under Trump will come close to that enjoyed under Obama.
The Year That Could Have Been

It’s well-known that 2016 was a very difficult year for active equity managers, as if purveyors of passive products were in need of a lifeline. That’s especially disconcerting because the year was one that offered—if nothing else—big potential for outperformance.
Today's Bull Versus The 1990s

The advance since March 2009 has just surpassed the bull market of 1990-1998 to become the second longest bull of all time, and it will move into the top spot if it can survive until next March 15th (the “Ides of March”). The current record holder is the 1921-1929 bull, which expired just a few days following its eighth birthday.
DJ Transports Move To New High

Wednesday's action erased two divergences cited in the latest Green Book, with both the NYSE Advance/Decline Line and the Dow Jones Transports moving to new bull market highs. The latter index had failed to do so for almost two years.
America’s Already First...

Thanks to the U.S. dollar’s recent spike, foreign equities in dollar terms declined during November while the U.S. markets were celebrating a Trump victory. Thirty-nine of the 49 MSCI country indexes are in bear market territory from the perspective of a dollar-based investor.
Putting “Our Spin” On The Positive Spin

Bull markets seem to create their own moods that lead to fundamental developments being viewed in a mostly favorable light.
Plenty Of New Highs, But Is There One Too Many?

While a raft of key market measures joined the S&P 500 at its latest cyclical high on November 25th, there’s at least one we’d prefer not to see on that list. Last Friday marked the first time in almost three years that the S&P 500 and the U.S. 10-Year Treasury Bond Yield closed at simultaneous 52-week highs. This has been a rare event since 1981, mainly because the path of bond yields has been relentlessly down over that time.
The Stock Market Is Non-Partisan

We’ve annoyed a few media outlets by admitting to having no clue as to which of the presidential candidates would be “better” for the stock market.
How To Beat The S&P 500 With The S&P 500
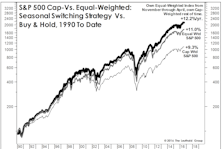
While 2016 is shaping up to be one of the most difficult years ever (on a relative basis) for active equity managers, one cannot blame the usual culprit of “narrow” market participation.
Is The Crack In Utilities A Broader Market Warning?
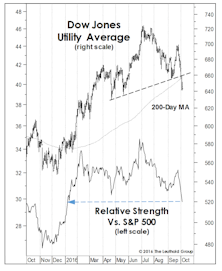
A few months ago, we mentioned the valuation risks that had built up in the stodgy Utilities sector, which at its mid-summer peak commanded a trailing P/E multiple of 24x—almost 10 points above its 1990-to-date median of 14.7x.
Only The Shadow Knows

If the above observation from almost a century ago remains on the mark (as it has for almost a century), then both the cyclical bull market and accompanying economic expansion should remain in force during the next several months.
Was That All There Was To It?
As quantitative investors, the disciplines of the numbers trump stories—even our own. But we’re struck that the stories depicted by our Major Trend Index and other market tools over the past two years are entirely logical and sequential. Unfortunately these stories rhyme with those of past market cycles.
Perception for the Professional
March 2026 Issue

Featured Articles
Sector Navigator
March 2026 Issue
