S&P 500
More Yield Curve Musings

The U.S. yield curve inversion has lasted long enough that even a few economic optimists now concede it will ultimately prove significant.
Where Would You Rather Be?
On October 3rd, the S&P 500 briefly traded below the high it made in January 2018 before reversing to close the day higher.
“Too Smooth” Of A Ride?

While investors in Value, Small Caps, and especially foreign stocks might beg to disagree, a key MTI technical measure suggests this decade’s stock-market ride has been almost entirely “pain free.”
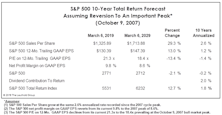
Pricing In “Peak” EPS
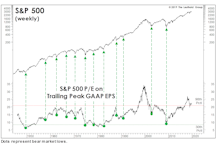
A recent theme in our valuation work is that we no longer need to assume a full-blown “reversion to the mean” to illustrate current U.S. stock market risks: Even a reversion to “old” bull market highs in ratios like S&P 500 Price/Sales, Price/Cash Flow, and Normalized P/E would result in bear-sized losses.
Factor Trade-Offs

A major difficulty in picking stocks based on quant factors is the need to make trade-offs. A company that looks attractive on one preferred metric will likely look unattractive on another. This study examines the uncomfortable give-and-take that complicates factor investing at the stock level.
The Stock Market’s Clark Kent
.jpg?fit=fillmax&w=222&bg=FFFFFF)
Mild-mannered and humdrum on the surface but a superhero underneath—that’s Clark Kent and, in recent months, the Low Volatility factor. Low Vol stocks are unexciting by definition, and the factor’s current holdings focus on utilities, REITs, and insurance companies.
The Cyclical Bull In Perspective

This ten-year boom—one that’s taken the S&P 500 to the second-highest valuations in history—has merely lifted the index to the top end of a channel that’s contained the S&P 500’s 6% annualized gain over the last nine decades.
The “Breakout” And Its Aftermath
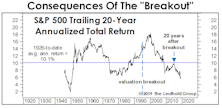
A common criticism of our long-term valuation work is that valuations shifted north into a new trading range during the 1990s, meaning Leuthold’s benchmarks (dating back to 1957 and earlier) are no longer relevant.
The P/E Decline Has Been Greatly Exaggerated
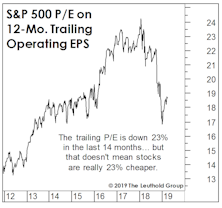
The S&P 500 has bounced back to levels seen at the January 2018 spike high, yet is valued more cheaply than it was 14 months ago.
A Confidence Game
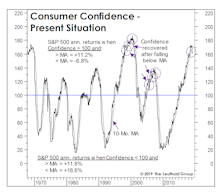
Several consumer confidence gauges plunged in the wake of the Q4 market decline (as expected), and then rebounded in a lagged response to the stock market recovery (again, as expected). But March saw the largest one-month drop in consumers’ assessment of their “Present Situation” since 2008.
Partying Like It’s 1998-99
.jpg?fit=fillmax&w=222&bg=FFFFFF)
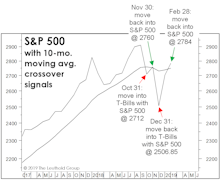
We thought Jerome Powell’s “Christmas Capitulation” would be tough to beat, but he accomplished that two days ago with what could be called his “Spring Surrender.” That, in turn, has rekindled hopes of a stock market melt-up along the lines of 1998-99, which, as old-timers will remember, followed a late-cycle correction that was nearly identical to the one seen last year.
A Scary Chart, Revisited

For a couple years, we’ve labeled the S&P 500 Price/Sales ratio as the scariest chart in the Leuthold database, and last year’s decline did little to improve its intimidating appearance.
Time To Jump Back In?
A few pundits have suggested that Jack Bogle’s death in January might prove to be the symbolic capstone to a cycle in which passive investing has completely dominated the full-fee, active money-manager ranks.
The Correction In Historical Context
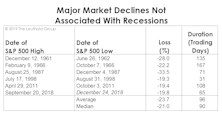
While it’s too early to let the ink dry on the accompanying table and chart, we’ve decided to add last year’s decline for comparative purposes.
Same As It Ever Was?
February’s Oscar win validated our efforts to make the ‘Green Book’ suitable for all audiences, like our decision to relegate “bottom-quartile” valuation outcomes to the very back of the publication.
Once In A Lifetime?

To paraphrase a talking head and the Talking Heads, someday you might find yourself in a beautiful deleveraging, with beautiful valuations, and you may ask yourself, well, how did I get here?
Yet Another Anniversary?

We received two media calls in December hoping we would comment for upcoming special features about the tenth anniversary of the bull market. We rolled our eyes.
Assessing The Cyclical Risks

With all the excitement over the Fed’s shift in rhetoric and the excellent subsequent market action, there’s a danger of losing sight of the broader cyclical backdrop for U.S. stocks. Remember, the economy is still operating beyond government estimates of its full-employment potential, and it’s not as if the Fed has actually eased policy—as it did successfully at a similar late-cycle juncture in the fall of 1998 and (ultimately unsuccessfully) in the summer of 2007.
2019 Earnings: Don't Bet On 6%

Currently, the collective intelligence of Wall Street is predicting 6% S&P 500 EPS growth in 2019. It’s also the 61-year average annual growth rate for the index, so how wrong could it be?
Guess-timating The Downside
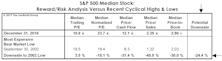
While our market disciplines remain negative, we certainly aren’t oblivious to the haircut in equity valuations that’s already occurred.
Perception for the Professional
March 2026 Issue

Featured Articles
Sector Navigator
March 2026 Issue
