S&P 500
Time For A “Donut” Break?
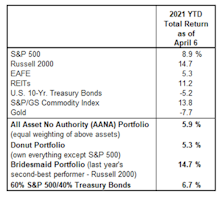
Despite a resurgence in Small Cap stocks and Commodities, it still feels like an “S&P 500 World” for asset allocators. The financial media remain obsessed with S&P 500 targets, S&P 500 earnings, and S&P 500 stocks. And why wouldn’t they be?
Stocks And Yields Revisited
.jpg?fit=fillmax&w=222&bg=FFFFFF)
The S&P 500 and 10-Year Treasury bond yield could accomplish something fairly rare today by closing at “joint” 52-week highs. The relevant levels to meet or exceed are 3934.83 on the S&P 500 and 1.49% on the bond yield.
Bond Yields “Take Down” An Old Favorite

The “lower for longer” interest-rate thesis propped up the S&P 500 Low Volatility Index for more than a decade. Rising bond yields have since helped drive this former darling to an 18-year relative-strength low. Yet, assets in the S&P Low Volatility ETF are still five-times larger than its High-Beta counterpart.
Climbing The Wall Of Confidence?
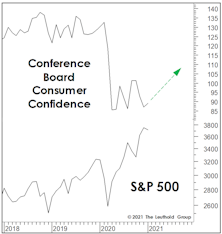
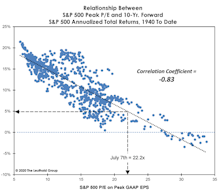
Stock market valuations may be considered the ultimate in fundamental measures, but they can just as easily be considered long-wave sentiment indicators. What causes equity investors to pay as little as 10x for S&P 500 Normalized Earnings at one point (March 2009), but pay more than 30x a dozen years later? The Fed printing press was in overdrive at both points; only emotions can account for the difference.
An Historical Look At Biden’s “Future”
.jpg?fit=fillmax&w=222&bg=FFFFFF)
We’ve read far too much about what Joe Biden and a newly-blue Congress might do in the months ahead, but less so about the conditions Biden and his team inherit. Such “initial conditions” usually have a heavy hand in policy outcomes, market outcomes, and even a president’s legacy.
Super-Rarified Air

The 2020 post-election stock surge looks and feels a lot like the 2016 “Trump Bump.” But, of course there’s a spoiler. The Biden Bump started with a Normalized P/E level about 30% higher than the one prevailing on election eve of 2016 (26.8x versus 20.5x, respectively).
S&P 500 Dividends? Thank You, No!
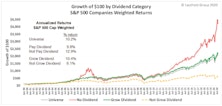
Dividends are a cornerstone of equity investing and over the decades they have produced a significant portion of the stock market’s total return. Previous Leuthold research has identified a strong dividend influence on total returns for small and midcap companies. Looking at S&P 500 constituents, we see that dividend growers outperformed companies that had flat or declining dividends – an expected outcome. However, we also found that companies not paying dividends convincingly outpaced dividend payers. This is contrary to the results in other market segments, but the explanation for this becomes apparent in the course of our research.
VLT’s Struggles Are Telling Us Something
Our Very Long Term (VLT) Momentum algorithm has been a very good “confirmatory” market tool over the years, especially at the onset of a new cyclical bull market. But VLT has proven to be of little to no value in navigating this year’s gyrations. VLT’s latest flip-flops reinforce our view that the market leaderboard is set to be rearranged.
Remembering Trump

Donald Trump will be remembered as the most polarizing political figure in U.S. history, but he was an unwitting consensus-builder on an issue that was long thought to be “settled science.”
A Wobble At The Top
.jpg?fit=fillmax&w=222&bg=FFFFFF)
Look, quick! Before it reverses! The Top-5 firms in the S&P 500 have underperformed in September! I’m sorry, you’ll have to forgive my sense of urgency, but the astounding speed and consistency in which these firms have outperformed may have burned the notion into my brain that they can only “go up” (or at the very least beat the index).
A Look At Two Historical Near-Misses

As we go to press (said no one in the digital age, ever!), the S&P 500 was moving to within a couple percentage points of its February 19th all-time high. Given still-high valuations for the blue chips and increasingly frothy sentiment, we think any break above that high will be underwhelming, if not a potentially historic “trap.”
Implications Of The “Breakout”

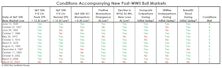
July’s developments led to us investigate the market valuations accompanying all past month-end S&P 500 breakouts which (1) eclipsed the prior month-end bull market high; and (2) made a new all-time high in the process.
How Much For Your “Free Lunch?”
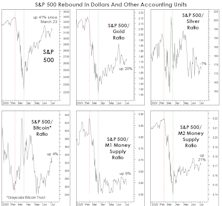
The 41% S&P 500 rally would be half as large if measured in terms of gold, and a “unit” of the S&P 500 now buys 70% fewer ounces of gold than it did in early 2000. Meanwhile, when denominated in either silver or Bitcoin, the stock market rally has been almost nonexistent.
Low Single Digits?
We encourage diversity of thought in our shop, but even pessimists among our ranks have a hard time making the case for a ten-year negative return for U.S. stocks, which was recently predicted by the founder of a large hedge fund.
The Money Supply Isn’t Magic

Imagine our surprise when the bullish stock market narrative is suddenly all about money. Cynically, though, that might be because money supply and the unemployment rate are the only economic data series staging upside breakouts, and the latter doesn’t lend itself to a good narrative.
A Long Boom, And The Ultimate Bust
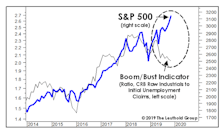
Last December, we marveled at the disconnect between the (surging) S&P 500 and the (sagging) Boom/Bust Indicator. Just six months later, we can only scratch our heads at what the hell we were complaining about.
Can The Rally Recover From Its 0-For-8 Start?
The current rally is either the first upleg of a new bull market, or the second-largest bear market rally in the last 125 years. The lone development that can settle the issue is for the S&P 500 to move above its February 19th closing high of 3,386.15.
Calculate The Next Low... With The Last Peak?
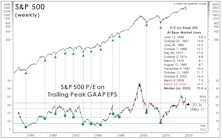
How does one value a stock market in which 12-month forward EPS estimates show their widest dispersion in history? A good start might be with methods we use when forward estimates show practically no dispersion (like three months ago). In either case, we place little weight on such estimates; each revision usually has only marginal impact on our 5-Year Normalized EPS.
There’s More To It Than That

It’s a down year for stocks, yet John Bogle must still be chuckling. A full-employment economy that had propped up one of the two most overvalued stock markets in U.S. history just suffered a cataclysmic “sudden stop.” Yet Bogle’s buy-and-hold disciplines have so far dodged the bear.
A “May Day” Revolution?
.jpg?fit=fillmax&w=222&bg=FFFFFF)
With May Day marches and demonstrations cancelled, the workers of the world have one less opportunity to remind us of the ever-widening wealth gap and the evils of the “Top 1%.” It’s a shame, because this was the year that we active managers would have stood shoulder to shoulder with those protesters voicing our own contempt for the “Top 1%”… of the S&P 500.
Perception for the Professional
March 2026 Issue

Featured Articles
Sector Navigator
March 2026 Issue
