S&P 500
Valuations: A “Progress” Report
.jpg?fit=fillmax&w=222&bg=FFFFFF)
As deep as the losses in the DJIA and S&P 500 have been, most professional investors recognize that those averages have masked the extent of the damage suffered by most stocks.
Better Than Bonds And An All-Time Record
.jpg?fit=fillmax&w=222&bg=FFFFFF)
The collapse of U.S. Treasury yields and the simultaneous end of the bull market has produced a new all-time record for the S&P 500, albeit under less-than-desirable circumstances.
A Signal Bulls Should Love...

There’s no question that it’s been a rough couple of years for stock market technicians. We noted earlier that if February 19th stands as the final high of the bull market, it would be only the third time in the last 100 years that the NYSE Daily Advance/Decline Line failed to provide at least a few months’ advance notice of the oncoming bear.
Valuation “Reset?”
The massive performance dispersion of the past two years makes it difficult (if not hazardous) to draw a simple conclusion about U.S. stock market valuations. But it’s safe to say that cap-weighted indexes like the S&P 500 and S&P Industrial Index remained significantly overvalued at the low point of the February correction.
Superhuman Feats Got Us Here
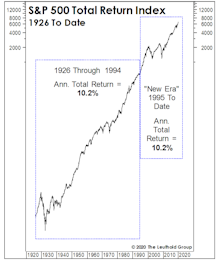
The simultaneous “New Era” ascension in margins and P/E ratios hasn’t generated anything exceptional from a return perspective. To the contrary, annualized S&P 500 total returns over this 25-year period of margin magic and (mostly) escalating P/E ratios merely match “Old Era” returns.
What’s Embedded In The Consensus?
.jpg?fit=fillmax&w=222&bg=FFFFFF)
Market momentum now seems to outweigh simple math in the minds of most investors, and we are not entirely immune. Today our tactical funds are positioned with net equity exposure of 50%, the midpoint of the normal 30-70% range. That’s a higher allocation than if we considered only business cycle dynamics and equity valuations.
The Stock Market Is Trading Like Trump’s A Democrat!
.jpg?fit=fillmax&w=222&bg=FFFFFF)
Around the time of Donald Trump’s inauguration in January 2017, we observed that prevailing valuations argued against him witnessing big stock market gains during his first term.
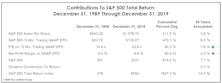
A Good Year To “Own It All”
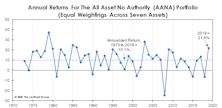
It’s no surprise that U.S. Large Caps were the #1 asset class performer in 2019. We were surprised that last year was the only one of the decade in which the S&P 500 won the annual performance derby. Here we review the annual performance of “Bridesmaid” asset class and sector, “Perfect Foresight,” and Lowest P/E sector.
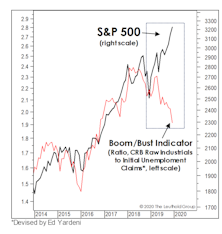
Stocks And GDP

Economists argue the best thing the stock market has going for it is the continuation of the U.S. economic expansion. Maybe.
Waiting For The Stimulus To Trickle Down...
Last year the Federal Reserve dumped historic stimulus onto a full-employment economy and an already richly-valued stock market. The stock market obviously loved it.
A Spectacularly Average Thirty Years
In the spirit of good holiday cheer, we made a partial concession to the True Believers with a December “Chart of the Week” in which we narrowed our stock market valuation analysis to the historically elevated levels of last 30 years.
A Blast From The Past
With 2020 representing The Leuthold Group’s 40th year of publishing Perception For The Professional, we perused the first few Green Books for relevant nuggets from 1981, but the backdrop could not have been more different. Therefore, we instead turned the clock back 20 years, thinking it might yield insights more resonant with today’s environment.
Valuations: An Updated “Modern” Take
.jpg?fit=fillmax&w=222&bg=FFFFFF)
An occasional critique of our valuation work is that we consider “too much” market history to form a judgment as to what constitutes “high” or “low.” This type of feedback declined during and after the financial crisis (when historic valuation thresholds were temporarily revisited), but it has become more pointed as the U.S. market has soared to new highs.
How Much Should We Pay For Market Momentum?
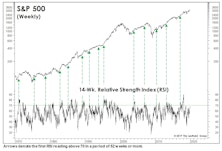
If the S&P 500 closes in the green today, an RSI "overbought" signal will be triggered.
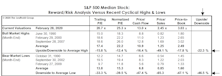
Risks Still High In The “Median” Large Cap
The relative domination of Mega Caps might leave the impression that valuation of the “typical” (or median) Large Cap stock is reasonable. It’s not. The fall rally leaves all major valuation ratios for the median S&P 500 stock in the top decile of the 30-year history, and above the levels prevailing at the September 2018 market high.
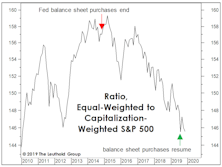
A Short-Term S&P Top?
The short-term path for equities “looks” clearer than at any point in 2019, with economic data having stabilized a bit in the last few weeks, the Fed having cut rates again and resumed balance sheet purchases, and some type of trade deal finally looking more tangible than a 2:00 a.m. Tweet.
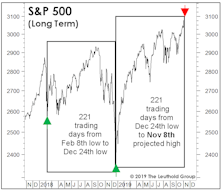
Back To Y2K?

The bull market took out another old record last month when the S&P 500 topped the cumulative total return of the 1949-56 upswing. The total return since March 9, 2009, is now 468%. Since the highs of March 2000, the S&P 500 cumulative total return is actually a few basis points behind U.S. 10-year Treasury bonds.
Owning S&P 500 At 2,900 In 2018 Vs. 2019

A look at underlying conditions at each stage of the bull market.
Giving Up The Ghost
.jpg?fit=fillmax&w=222&bg=FFFFFF)
The approach of Halloween brings thoughts of jack-o-lanterns, scary movies, and buckets full of candy. The season also marks the time when investors finally give up the ghost on the optimistic, even wishful, earnings forecasts made early in the year.
If Your Team Is Out Of The Playoffs, Here’s A New Gamble
.jpg?fit=fillmax&w=222&bg=FFFFFF)
With promised breakthroughs on Brexit and the trade war miraculously occurring on the same day, few pundits now believe the market is anywhere close to an important peak. (A peak in the S&P 500, that is, since peaks occurred long ago in the ACWI, MSCI Emerging Markets, NYSE Composite, Value Line Arithmetic, S&P MidCap 400, and the Russell 2000.)
Perception for the Professional
March 2026 Issue

Featured Articles
Sector Navigator
March 2026 Issue
