S&P 500
What Is Driving S&P 500 Earnings Growth?

The Energy sector is really driving S&P 500 earnings Growth.
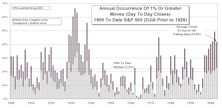
Debunking One Myth Of The Buy And Hold Rationale
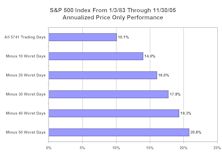
Debunking one myth of buy and hold rationale. Showing how stock market returns change if investors avoid the best and worst performing stock market days. Essentially, anything can be proven with statistics.
Boosting Inflation Projections

Boosting our 2005 inflation projections based on continuing high energy prices and anticipated above average September CPI/PPI inflation readings. Also, the implications of higher inflation.
Revisiting Sector Profit Margins: Data Now Expanded Back The 1950s

On an aggregate basis, we see little room for further margin improvement, but there are select areas we believe may yet be poised for additional (slight/moderate) expansion.
Examining the Recent S&P/MSCI Global Industry Classification System (GICS) Changes
Standard & Poor’s/MSCI did their annual review of the GICs groups and made some changes...in a few cases adopting groups we had already established at The Leuthold Group and had been tracking for several years. This month’s “Of Special Interest” discusses the changes and presents our take on the new groups.
Examining Oil Prices Vs. The S&P 500

A chronological chart of the relationship between oil and stock prices.
New Histogram: Oil Prices Vs. The S&P 500

This month, Eric Bjorgen presents a unique take on stock market valuations, by determining how many barrels of oil it takes to buy one unit of the S&P 500. Based on the historical relationship, the stock market is not overvalued versus oil.
Constructing A History Of The "Estimating The Downside" Calculation

Historical tracking of our multi-factor valuation model.
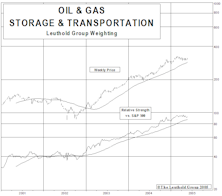
Recent S&P Sector Weight Trends Within The Current Bull Market

The S&P 500’s largest and most rapidly increasing sectors.
2005 S&P 500 Earnings Estimates Revised 2% Lower

Revised 2005 earnings for the S&P 500 down from +10% to +8%. Q4 2004 earnings stronger than anticipated. Will make for tougher comparisons at 2005 year end.
Profit Margins At The Sector Level

An expanded discussion of profit margins broken out by broad sectors. Expect some expansion still in Materials and Energy, as well as possibly Tech. Contraction anticipated in Financials, Consumer Discretionary and Telecom.
Large Cap Versus Small Cap

Small caps continue to be the market leaders over large caps. This trend is expected to continue into 2005, as our small cap leadership model has recently improved, and is now rated slightly positive.
Keep In Front Of The Economic Curve

Stock market is a leading economic indicator, and typically turns down before the economy turns down. On average, 40% of the stock market decline occurs before the recession begins.
Tracking The Market Recovery…..Bull Market Maturing, But Still Some Upside Potential

Based on the typical recovery, we constructed a series of monthly price targets for the S&P 500, going out 24 months from the October 9, 2002 bear market low, and from the March 11, 2003 secondary low.
NASDAQ vs. S&P Market Weights
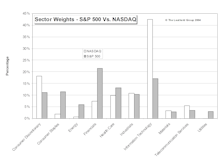
Comparing the sector weights between the NASDAQ and the S&P 500.
Tracking The Market Recovery…..Still 9%-12% Potential Upside

The current recovery has been tracking somewhat below the performance averages of past bear market recoveries.
Tracking The Market Recovery

Based on the long term averages, there is additional upside to the bull market in 2004, if the S&P 500 tracks the “classic” recovery pattern.
Tracking The Market Recovery

Based on the long term averages, there is additional upside to the bull market in 2004, if the S&P 500 tracks the “classic” recovery pattern.
Volatility Update…..Both Indexes Show Lower Volatility In 2003
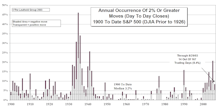
Volatility continues to fade in the S&P but remains volatile on a historical basis.
Volatility Update…..Both Indexes Show Lower Volatility In 2003
In 2003, the NASDAQ has not been as volatile as in recent years, but is still more volatile than the S&P 500.
Perception for the Professional
March 2026 Issue

Featured Articles
Sector Navigator
March 2026 Issue
