S&P 500
Summer Market Hot?…..Or Not?

Statistically the summer rally is mostly fiction, historically producing average or slightly below average stock market performance….but don’t plan a three month vacation yet!
Volatility Update...No Significant Signs Of Slowing Volatility Yet

So far in 2001, 62% of trading days qualify as Extreme Volatility compared to the historical norm of 4% since 1971.
Volatility Update...No Significant Signs Of Slowing Volatility Yet

In 2000, the NASDAQ was the most volatile it had ever been. However, in 2001, new standards are being set.
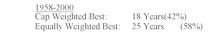
Bull Market Returns: Missing the Best/Worst Days

Is a market timing strategy superior to “buy and hold”? You can prove anything with numbers. Despite that, there does appear to be a supportive case for tactical asset allocation, or market timing.
S&P Technology Weighting Falling

S&P Technology Weighting has fallen to about 21.9% from nearly 35% in February. Expect it to fall to 20% or below (recession?) within the next year.
Large Cap Versus Small Cap: Inside The S&P 500
Poor performance by Large cap technology issues had a very negative impact on S&P 500 cap weighted performers in 2000.
Volatility Update

The current volatility in the NASDAQ is unprecedented over the 30 year life of this index.
Volatility Update

S&P volatility accelerates in October while NASDAQ volatility continues at unbelievable levels.
Volatility Update

S&P volatility moderating while NASDAQ volatility bounced back to very high levels.
Volatility Update

Down significantly In August...New trend or anomaly?
Volatility Update…Today’s S&P Volatility Reminiscent of 1987

No year in NASDAQ history even approaches this year’s volatility!
Volatility Update

NASDAQ Volatility - Unprecedented! First step toward trading in decimals will begin this fall. Barry Small, CEO of Weeden & Co., offers his insights on the impact on liquidity and potential volatility for the U.S. markets.
Volatility Update…Incredible Volatility In 2000!

This is the most volatile market year for the S&P 500 since 1938. Now well beyond the 45.1% level recorded in 1974.
Volatility Update…Incredible Volatility In 2000!

NASDAQ moved 1% or more every day but one in April!
Volatility Update…Very Volatile Year So Far!

This is the most volatile market year for the S&P 500 since 1938, now surpassing the 45.1% level recorded in 1974.
Volatility Update…New Year Brings High Volatility

NASDAQ Index volatility has skyrocketed to nose-bleed levels since 1993.
Market Volatility...Market Liquidity

Billion share days, but a dearth of liquidity for institutions, as market makers contract commitments and ECNs fragment the market.
Volatility Update…Year End Summary

While the 1930s were more severely volatile for the S&P, 1999 ranks second only to the 1974 record (45.1%) in the post WWII era.
15 Year S&P 500 Performance In Perspective

Once again, the stock market has soared to another year of strong performance. Returns of 20%-30% are becoming the norm.
Volatility Update…On The Rise

October proved to be as volatile as its reputation.
Perception for the Professional
March 2026 Issue

Featured Articles
Sector Navigator
March 2026 Issue
