Inside The Stock Market ...trends, cross-currents, and outlook
The Bear Market In P/E Multiples Rages On
Throughout most of the COVID rebound, market bulls told investors (correctly) to ignore valuations and simply ride the liquidity tide. But with that tide now flowing out (and at possibly its fastest speed ever), guess what the one-time liquidity junkies see as a reason to stay in stocks? Yes, cheaper valuations!
Nothing Close To A “Thrust”

Many technicians claim that the rallies of late March and late May generated impressive “breadth thrusts.” We’re skeptical: We’ve tested many tools that attempt to capture such a phenomenon, and found that the most reliable thrust signals aren’t ones that show up every couple of months.
What Will A Low “Look Like?”

We think it’s much too early to be looking for a major bottom in stock prices, but it’s worth reviewing some of the signals that will help confirm such a low is at hand.
Down, But Hardly “Oversold”

Historically, a good measure of a fully oversold market has been a drop to negative by our VLT Momentum algorithm. YTD, it has been on the downswing, but is still in the vicinity of its highs reached during the Trump Bump. If the May bottom in the S&P 500 turns out to be the final low for the decline, VLT would be one of many suggesting the new rally is among the riskiest in market history.
Unfinished Business

Our tongue-in-cheek celebration of the bull market’s second birthday in late March looks premature. But the “Terrible Twos” we warned about have erupted in full force.
Past Pivots Put Powell In A Predicament

Market conditions leading up to the May rate hike were similar (if not worse) than those that triggered Powell’s late-2018 “pivot.” Free-market tightening of 2022 is apt to play into the path of policy. There’s likely a dovish “pivot” in store later this year—one that may be aggressively sold rather than bought.
The Case Of The Missing “Puts”

In the last few months, we’ve warned that Wall Street’s favorite security—the Federal Reserve Put—has been at least temporarily replaced by a novel derivative with a less favorable risk/reward profile: the short Fed call.
Not Dot-Com
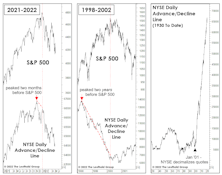
Bulls have been quick to assure us that this market “bears” no resemblance to the dot-com bust. We agree—but probably for very different reasons. Among them are the conventional breadth measures, which provided little warning of this year’s January peak. And, the initial decline off January’s top has been much broader than during the first phase of the dot-com bust.
Who Doesn’t Love A Sale?

The S&P 500 closed May 5th with a moderate 13.5% loss from its all-time high, a move that explains only part of what’s already been an historic bear market—in P/E ratios, that is.
Peak EPS: Another Critique
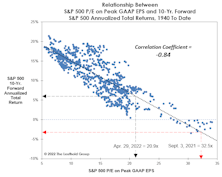
It’s only been a few years since we added the Peak P/E ratio to our suite of market valuation measures. That situates us in the uncomfortable position of having to explain why a big decline in this newer metric might be misleading.
Stocks, Inflation, And Reverse Causality
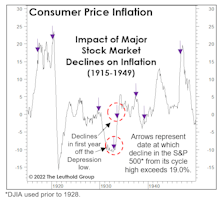
Forget interest-rate hikes and quantitative tightening. There exists a very important weapon in the fight against inflation that the Fed did not have at its disposal in the 1970s: an overvalued stock market.
“Donuts”—The New Comfort Food
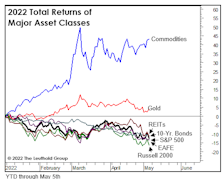
For the last few years, the S&P 500 has been the most richly priced of the broad equity indexes, and its moderate decline, to date, makes it even more so on a “relative” basis. In recognition of that, we began to track the hypothetical allocation strategy of avoiding this index.
Cycles: Is The Worst Yet To Come?
Does the market’s poor YTD performance prior to the six-month “Sell in May” combined with the Presidential Election Cycle help “inoculate” it against a typical mid-year, mid-term swoon? Yes, there’s some evidence to support that view—especially with Small Caps.
History In The Making?
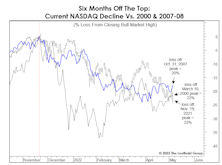
They didn’t ring a bell at the NASDAQ’s November 19th top, but shortly thereafter we wrote that the day was notable in that it was only the third time in history that a pair of our weekly Technical sub-models closed in “maximum bearish” territory at the same time.
Welcome To The Terrible Twos!

In late March, the S&P 500 came close enough (3.5%) to its January high that a second birthday celebration for the bull seemed warranted. Who doesn’t love a party? But, as we noted in a recent Chart of the Week, a milestone like this is a good excuse to haul our pet to the veterinarian for a checkup.
The Terrible “Two-Year”
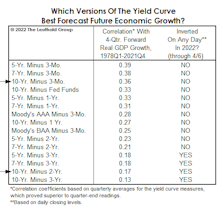
In a simple test of 15 yield-curve variants, we found that the 2s10s spread ranks second to last, based on its correlation with one-year-forward real-GDP growth since 1978. The three best measures employed the 3-month bill as the “short” rate. The spread between the 5-year note and 3-month bill showed the strongest correlation with subsequent economic growth.
X-Rays And EKGs
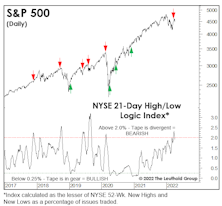
In late March, the S&P 500 rallied to within 3.5% of its January high, likely prompting producers at CNBC to put in an order for “S&P 500 5,000” hats. But we think that 4,000 will be undercut before 5,000 is topped, and action in key indexes (with the notable exception of the S&P 500 itself) reinforces our view.
Signs Of “Demand Destruction?”
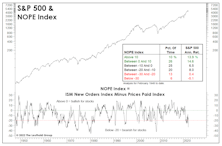
They are simple measures, but our “NOPE” Indexes capture (as well as anything) the escalating inflation squeeze on businesses and consumers. To recap, the NOPE is the spread between the ISM New Orders Index and the Price Index, which can be calculated for both the Manufacturing and Services sectors.
Consumers’ Misery Is Also The Fed’s
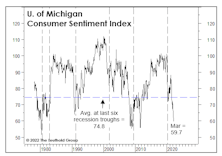
An already-low unemployment rate has dropped another 0.3% YTD (to 3.6%) and stocks’ rebound in the second half of March took the S&P 500 to within 3.5% of its all-time high. Yet Consumer Sentiment has sunk to 59.7—a reading that’s 15 points below the average seen at the last six NBER business-cycle troughs. Why the long faces?
Earnings: Reversing The “New Normal?”
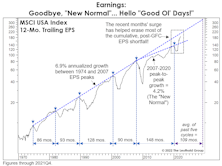
If earnings’ nearly vertical ascent continues for another six months, 12-month trailing EPS will intersect the 6.9% long-term-growth trend line connecting the five major EPS peaks between 1974 and 2007. The “New Normal” has given way to the “Good Ol’ Days!”
Perception for the Professional
May 2026 Issue

Featured Articles
Sector Navigator
May 2026 Issue
