Inside The Stock Market ...trends, cross-currents, and outlook
Not If, But When

Economists who believe a 2023 recession will be avoided, may not know it but they are “messing with perfection.” Since August, we’ve chronicled several developments that have, without fail, correctly forecasted past recessions, or confirmed that one was already underway.
“The Streak” Is In Jeopardy…
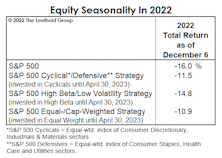
With less than a month to go, our hypothetical All Asset, No Authority (AANA) Portfolio seems likely to beat the S&P 500 on an annual basis for the first time since 2011. However, it’s doubtful that many real-world, institutional multi-asset portfolios were as heavily exposed as AANA to the best-performing assets—commodities and gold.
Mixed Messages From VLT

While VLT for the S&P 500 continued to trend lower in November, the DJIA calculation edged higher and triggered a new BUY signal. The message could soon get more confusing: A BUY signal for the Russell 2000 would be triggered if that index closes December above 1,813, while the S&P 500 and NASDAQ would have to climb more than 11% and 15%, respectively, to trigger a VLT BUY.
A 2022 Trifecta?
Our Major Trend Index has four factor categories, and three of them (Valuation, Cyclical, Technical) remain negative. Yes, the bearish “trifecta.” If that sounds like a reprint of one of our Monday MTI memos, bear with us (pun intended). We thought the MTI—with over 125 inputs—was pretty exhaustive. It turns out that it’s lacking entire categories pertinent to stock market action:
Beware Of The Changing Of The Guard
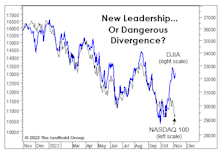
A rotation from Growth to Value resumed in grand fashion in October. Qualitatively, new leadership sounds like a good thing. Statistically, bulls ought to hope that the tape gets back into gear.
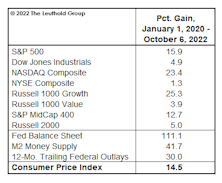
Economy Soaking Up Scarce Money Supply
There might be “too much money chasing too few goods,” but some monetary measures imply there’s “no longer enough money” to finance production of those goods and still support a stock market that’s far from cheap.
Which Yield Curve?
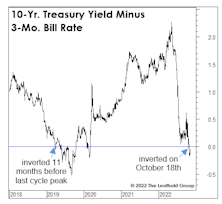
Last month’s inversion in the 10-Yr./3-Mo. Treasury spread further tilts an already lopsided scale in favor of a U.S. recession in 2023. That spread has been considered the gold standard from an economic forecasting perspective, and is the basis for the New York Fed’s Recession Probability estimate (which, by the way, should break above its critical 35% threshold when it’s published later this month.)
The World As Powell Sees It
When the economy falls into recession, labor market measures will be among the last to tell us. We can’t resist watching them anyway, for two reasons. First, we know that the Fed’s self-proclaimed data dependency is unduly reliant on lagging data points, like the monthly employment report. We want to see what the policymakers are seeing, even if that sometimes means using the same, fogged-up rearview mirror.
Here We Go Again...

No surprise here—October’s rebound put technicians on alert for a “breadth thrust” for at least the fourth time since the bear market began in January. On the whole, technicians have performed better than most this year, but their obsession with new and creative ways to capture the thrust phenomenon is a sign that even this normally flexible crowd is eager to get long(er) as soon as possible.
VLT: A Double-Sworded Edge

“Oversold” usually has a positive connotation in financial jargon, yet history’s worst air-pockets have almost always occurred when the stock market was deeply oversold. More time is needed before a “low-risk” entry point for the S&P 500 will be triggered from the VLT’s currently “oversold” status.
Thoughts On The Secular Outlook

Some have speculated that 2022 might have been the kick-off for a decade-long era in which the broad stock market indexes will make essentially no progress, like 1966-1982. However, that earlier experience provided opportunities within other market segments, which will also stand a much better chance in coming years.
Valuation Mirage?
Thanks to the 2009-2021 experience, an entire generation of investors can’t distinguish between a stock market that’s down in price and one that’s actually “cheap.” The current bear market seems on course to make that distinction relevant again.
A Trade Contrarians Will Love

Time cycles have been spot on in 2022, with the stock market declining through the mid-year months (May-October) of a mid-term election year. But November 1st saw the opening of the market’s most bullish window according to the same patterns.
Bonds: Not A Four-Letter Word
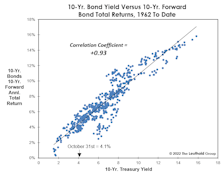
The bond market bubble has popped, and forward-looking Treasury returns are no longer a disaster. We aren’t suggesting one pile into them with yields near 4% and inflation around 8%, but we think they have suffered a much more substantial de-rating than large-cap stocks.
Roaring Good Times...
Boy, were the pundits ever right about the Roaring Twenties. Less than three years into the decade, the animal they fear most has already roared two times. Actually, the first one, in the first quarter of 2020, was more like a piercing “yap,” taking the S&P 500 down almost 34% in just 23 trading days. The second roar has been a deeper, more guttural one that’s lasted nine months and is probably not done.
Tightening Into A Slowdown: Month Eight

We think the U.S. economy will slip into recession sometime in the next year, but the level of “excess savings” provided by pandemic aid renders the already difficult task of timing more elusive than ever.
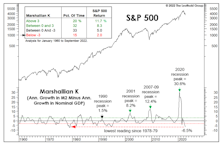
Powell Doesn’t Need To Be Volcker

The current bear has been no more than moderate based on conventional measurements. However, the loss of market wealth in relation to GDP is not too far from the levels suffered during the Great Financial Crisis.
Past Pivots Prompted By Politics
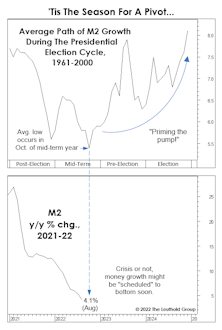
We scrutinized the typical path of money growth during the four-year presidential election cycle, and found that it typically tends to bottom out in October of the midterm year! The cycle says a monetary pivot is imminent, and the average pattern traced out by M2 suggests an acceleration in the growth rate of about 2.5% leading up to the presidential election.
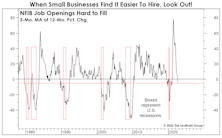
No Longer An Emphatic “NOPE”
While the MTI’s Cyclical category remains hostile at -3, we’ve observed steady improvement in its leading inflation components. Especially notable is the reversal in the NOPE Index (ISM New Orders Minus Price Index).
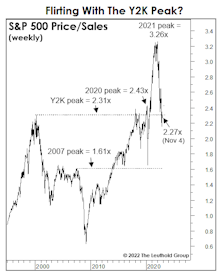
A Valuation Check-Up
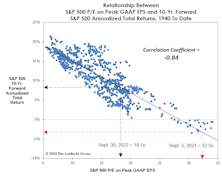
The P/E multiple on Trailing Peak GAAP EPS has plunged 44% from its year-ago peak of 32.5x. The current ratio of 18.1x is below its “New Era” median (1995-to-date) —but some conditions characterizing the New Era no longer apply.
Perception for the Professional
May 2026 Issue

Featured Articles
Sector Navigator
May 2026 Issue
