Inside The Stock Market ...trends, cross-currents, and outlook
Banks: Happy Anniversary!
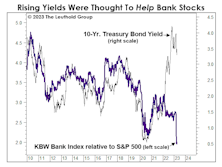
This year marks the 25th anniversary of a slew of major bank mergers: Wells Fargo/Norwest, Banc One/First Chicago, NationsBank/BankAmerica, Star Bank/Firstar, First Union/CoreStates Financial, and SunTrust/Crestar Financial. Who knew the KBW Bank Index would celebrate the occasion by returning to its price level of that same era?!
Yet Another Thing The Fed Has Screwed Up...
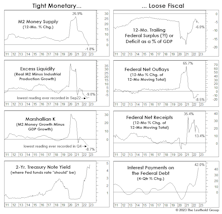
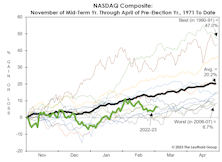
In today’s cycle, we’ve not yet observed the usual pre-election “ramp” in M2 growth. That might help explain why the traditionally hyper-bullish, six-month window beginning at the time of mid-term elections has so far been underwhelming.
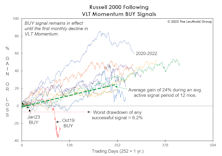
VLT: You Read It Here Last
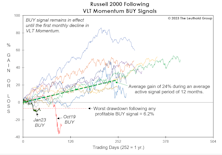
We anticipated it for months, and now that it has finally happened, we’re burying the news in the final page of this section. Yes, the last day of March saw the S&P 500 trigger a “low-risk” BUY signal on our Very Long Term (VLT) Momentum algorithm, known elsewhere as the Coppock Curve.
Bulls, Bears, And Boxing

Bears normally walk on all fours, just like their congenitally happier counterparts. But images we see of bears attacking prey (or humans) usually show them on two feet. Maybe there’s a lesson there.
In The “Eye” Of The Beholder

Stocks could trade higher in the next few months as CPI numbers enjoy easy year-to-year comparisons, prompting a more soothing tone in daily Fed-speak. Then again, the lagged impact of the last year’s rate hikes and balance-sheet shrinkage has yet to materialize, meaning we’re likely in the eye of the storm.
Inadvertent Easing?
Sometimes, a sharp upside reversal in the stock market will correctly anticipate future improvement in monetary and liquidity conditions. That was the case with the powerful up-leg that sprang from the market’s 2018 Christmas Eve bottom.
Why NASDAQ’s Gains Are A Disappointment
The run-up in Tech and the NASDAQ has been impressive, but their relative strength in recent months might be considered substandard from a “cyclically-adjusted” perspective.
A Real Stumper

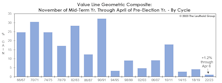
The equally-weighted Value Line Geometric Index has generated a 32.4% annualized price gain during the best six months of the presidential election cycle, measured back to its 1964 inception. In the other 42 months of the cycle, the index produced a -0.7% average annualized return.
Rose-Colored Remembrances
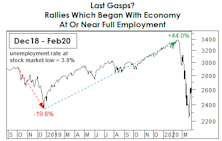
Monetary conditions have worsened, recession evidence is piling up, and some of our Large Cap valuation measures have returned to their tenth historical deciles. However, with the economy near full employment we thought it worth revisiting the past to find examples where the market might have temporarily thrived under similar circumstances.
CBO: The Ministry Of Misinformation?
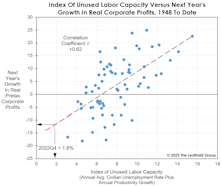
After failing to publish an estimate for the GDP Output Gap for nine months, the Congressional Budget Office has just decreed that the economy has yet to reach its full-employment potential!
The Late-2022 Recession That Wasn’t
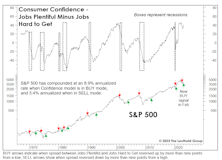
Our Treasury Secretary (and former Fed Chair) has described the JOLT survey (Job Openings and Labor Turnover) as her favorite labor market indicator. We don’t know why: It’s a good survey, but similar figures become available about two months in advance of JOLT.
The Yield Curve Meets Microsoft Excel
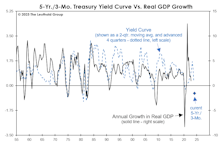
To our surprise, the measure that most closely correlated with real-GDP growth on a one-year time horizon is the rarely mentioned Treasury spread for the 5-Yr./3-Mo.
Meanwhile, In “Relative World”...
A large swath of the institutional asset-allocation world is engaged in the sometimes dangerous, binary game of “stocks versus bonds.” Although the 2022 bond debacle caused relatively mild damage to a massively overweight equity position, the bear markets of 2000-2002 and 2007-2009 produced losses for stocks versus bonds that exceeded 60%.
Might VLT Be Out Of Step?
Unless the S&P 500 and NASDAQ correct more than 5% from their March 6th levels by the end of the month, both will trigger new VLT BUYs. Rather than celebrating that prospect, however, we find ourselves wondering what might go wrong.
Small Cap Malaise
Imagine telling a Small Cap investor in mid-2018 that: (1) the U.S. economy would spend all but two months of the next 4-1/2 years in expansionary mode; and (2) M2 money supply would increase by 50% in that time, and yet the Russell 2000 would gain a grand total of just 9% over the same span.
Not Quite In Sync

At nearly 4-1/2 months, the stock market rally has reached an age where the Technical confirmation should be overwhelming if the upswing is in fact the first phase of a “new” bull. That’s not what we observe, however.
Times Are Still Tough For “Timing”
YTD, passive strategies are again ahead of most attempts at timing, though we still believe that asset allocation success over the next several years will require much more use of the latter.
No Punch Bowl? No Problem!

Stocks are off to a strong start in 2023, and speculative juices are again flowing. In the final week of January, NASDAQ trading volumes were eight times those of the NYSE, a level seen only at the very peak of the meme-stock mania in early 2021. (Pre-COVID, the ratio oscillated between two and three. It’s a brave, new world.)
Irrationality Is Back, Right On Schedule
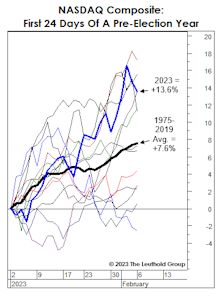
The hostile monetary backdrop makes recent stock market exuberance even more irrational than in early 2021. Yet, this is the middle of a seasonal window that historically boasts an elevated level of craziness: It is the year preceding a presidential election—a time when monetary and fiscal stimulus are ramped up.
Another Thrust, Right On Schedule

Among the latest bullish cues, we’d put the most weight on the MBI breadth-thrust signal because it’s the only one among a variety of measures we track that hasn’t falsely triggered during a bear market. Perhaps its first misfire is imminent.
Perception for the Professional
May 2026 Issue

Featured Articles
Sector Navigator
May 2026 Issue
