Inside The Stock Market ...trends, cross-currents, and outlook
TINA: Gone, But Not Forgotten

There’s an institutional segment of the tactical asset-allocation universe that believes it all boils down to “stocks versus bonds.” We find that world-view dangerously limiting.
Multi-Asset Madness

It’s been said that the definition of insanity is doing the same thing over and over again and expecting different results. But that quote was from a physicist who was lucky enough to deal with natural laws, not with the “madness of crowds.”
New Policies, Old Outcome

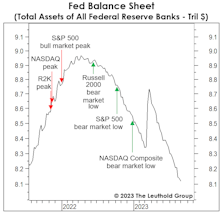
At long last, we’ve exited an investment world that was defined for more than a decade by zero interest rates and Quantitative Easing. Or so we thought.
Fooling Ourselves?
In early September, the co-founder of one of the largest U.S. private equity firms declared that predicting recessions is a “fool’s errand.” We couldn’t disagree more.
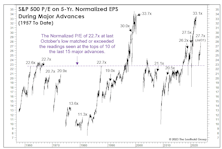
A Flawed Model Proves Our Point

In early September, rising bond yields and a falling Forward Earnings Yield caused the Fed Model to rank the S&P 500 at its least-attractive level relative to Treasury bonds since mid-2002. We think this illustrates—better than any other measure—why market pundits have finally jilted their mistress of a dozen years: TINA.
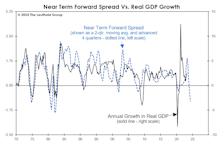
The LEI Clock Is Ticking
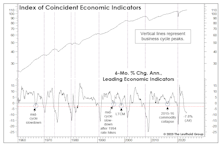
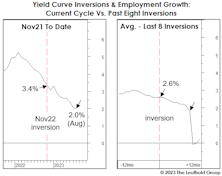
A contraction of 3% or more in the LEI’s six-month annualized rate-of-change has always been associated with a recession, with an average lead time of four months. Using that guideline, the most recent recession warning was triggered in June 2022, and the lead time is now approaching the longest ever recorded (16 months in 2006-07). If today’s lead time matches the 2006-07 experience, the business-cycle peak will occur in October.
Labor Market Begins To Labor...
Most labor market measures continue to weaken, and for investors still heavily invested in stocks, we’d caution against waiting for all labor market figures to deteriorate before scaling back. Equities will likely take a big dive before such conclusive evidence arrives.
Small Caps: Unresponsive
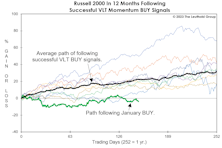
Based on successful Russell 2000 VLT BUY signals, 1982-forward, the index had gained an average of 23% eight months later—and none had a losing position. Since the VLT BUY on January 31st (eight months ago), the Russell 2000 has dropped 3.9%. Furthermore, Small Caps bottomed 15 months ago, and in a normal cyclical bull market, the Russell 2000 would be up 50-70% by this time.
Confidence Cracking?
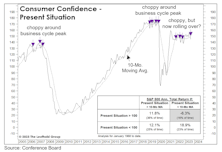
After hovering near the highs of the post-COVID expansion, in August, the Present Situation Index turned down, and is now below its 10-month moving average for the first time since December. When this measure is at a high level, but declining (like now), it is the worst backdrop for stock performance.
Don’t “Bank” On A New Bull…
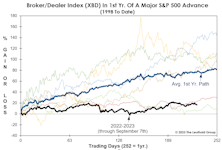
The Broker-Dealer Index (XBD) is one of just a handful of indexes to surpass its old bull market high, but its gains are far below average for the first year of a major advance. Meanwhile, the BKW Bank Index (BKX) is revisiting price levels of 25 years ago—it is just one percent above the average daily close in 1998. Yes, as a group, the big banks have been dead money for 25 years (excluding dividends).
Calibrating The Curve
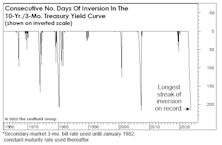
Bloomberg macro strategist, Cameron Crise, noted in early September that the 10-Yr./3-Mo. Treasury-yield spread was set to exceed the old record of consecutive days (217) in negative territory. That threshold, established in 2006-07, was indeed broken on September 7th, and—with the spread still more than 100 basis points—an end to the current inversion episode is hardly on the immediate horizon.
Delayed Reckoning?
The month of October gets all the “love,” but since 1990, August has been the cruelest month for stocks. We point this out because calendar patterns lately seem to explain this market better than just about anything else. In 2022, big losses in stocks and bonds arrived right on schedule—during a time of Jewish sabbatical (the Shmita Year).
Premature Aging?
If today’s stock market is indeed a new bull, its vital signs advise that it is more in need of a coffin than a cradle. Monetary policies, both in terms of rate hikes and the inverted curve, have never been more hostile at this stage of a major stock market upswing.
A Delayed Day Of Reckoning?
Today, the recession / no-recession call dominates daily market debate probably more than any time since the spring of 2008 (when the economy had been in recession for 4-5 months). We fully expect the U.S. economy to roll over in the next several months.
Has The Stock Market “Eased?”
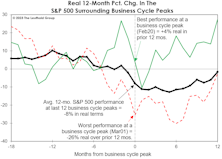
The path of real stock prices in the current cycle looks very different from the typical pre-recessionary track. In fact, based only on the chart of performance in real terms since January 2022, we’d probably believe the economy has recently emerged from recession.
The 2022 “Tax Hike” Repealed!
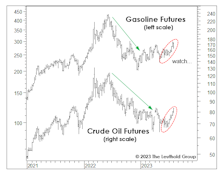
In the last twelve months, spending on energy goods and services as a share of total consumer outlays dropped by 1.1%—that amounts to about $200 billion in savings (annualized).
Fiscal “Juice?”
Not to pick a fight with Keynesians (or other economists), but we’re reluctant to label the explosion in the federal deficit as unequivocally “stimulative.” Some factors behind the increase probably do boost the economy, but others simply rob Peter to pay Paul.
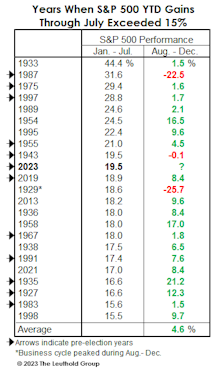
“Bear-Killing” Rally?

The S&P 500 came within 4% of its early-2022 high on July 31st, and some technicians insist that such a powerful recovery of bear-market losses has invariably been a bear killer. In both 1957 and 2000, however, bear rallies brought the SPX to within 1% of its prior high; and it’s worth noting, in 1957, the mid-July retest gave way to a recession in just six weeks.
Lowering The Bar!
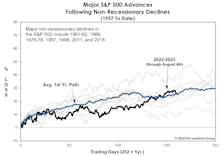
As we’ve noted, none of the major indexes has kept pace with the typical path traced out during past cyclical upswings. It has since occurred to us that this nearly ten-month stock rally is being compared to an unrealistically high standard: The current advance doesn’t have the advantages enjoyed by bulls that launched out of recessionary conditions.
Gold: Not As Shiny

In mid-July, we sold our tactical portfolios’ small (2%-ish) position in physical gold ETFs. That holding had been built up from 2018 to 2020 to around 5.5% of the portfolio, then pared in early 2022 when Russia invaded Ukraine. That doesn’t mean we’re gold bears.
Perception for the Professional
May 2026 Issue

Featured Articles
Sector Navigator
May 2026 Issue
