Inside The Stock Market ...trends, cross-currents, and outlook
Breadth Catch-Up!
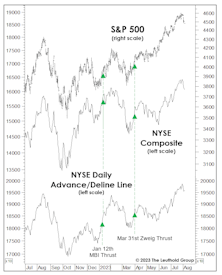
The market broadened enough in July for the NYSE Daily A/D Line to “confirm” new SPX highs—a statistical positive: When the A/D Line made a concurrent 12-month high during July, the average return for August-December was +6.5% versus -1.1% when breadth didn’t confirm the index.
Pretty Darn Neutral
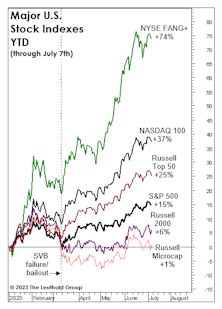
Last month’s title, “Echoes of 2021,” didn’t fully capture the speculative fervor that’s gripped big Technology stocks—and the NYSE FANG+® Index immediately set out to rectify that shortfall by tacking on another 5% to bring its YTD return to +74%.
Neutral (But Leaning Negative)
U.S. stocks have either begun one of the most underwhelming and economically illogical bull markets in history, or have staged an exceptionally long and deceptive bear market rally. Our bet is on the latter.
Job Market Deja Vu
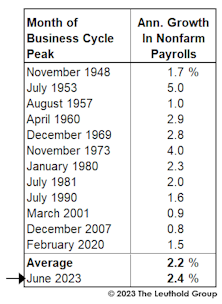
With leading economic measures still trending down, optimists who advocated against fighting the Fed during the free-money era have ditched their own advice. Their focus is now on lagging indicators, like the employment numbers—but that last bastion of strength seems ready to buckle.
Don’t Let Economists Work From Home…
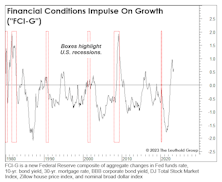
Last month, we noted that Jay Powell’s preferred measure of the yield curve—Near Term Forward Spread (NTFS)—was a winner, but a newly introduced index by the Fed, “Financial Conditions Impulse on Growth (FCI-G),” is a dud. Several simple forecasting gauges we’ve relied on for years are considerably more effective.
Maximum Inversion?
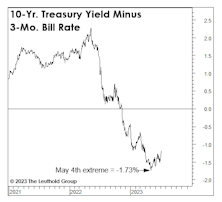
Factoring in both the duration and depth of the existing yield-curve inversion, it is considered more severe than all predecessors since the 1960s. Even Duke University yield-curve guru, Campbell Harvey, abandoned his January forecast that a recession would be avoided.
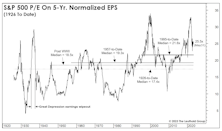
Another Chance To “Buy High”
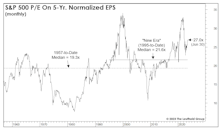
Despite this year’s massive underperformance by the Equal Weighted S&P 500, the median stock doesn’t appear substantially more attractive than the cap-weighted index. Three of five valuation measures are now back in the top decile of readings, which we’d consider pricey in any monetary or economic backdrop.
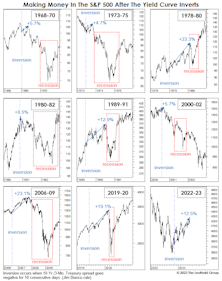
If It’s A Bull, How Does It Stack Up?
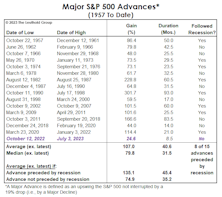
Although we can’t claim that the 2022 decline purged the economic and stock-market excesses for another multi-year bull, there’s nothing in the action of the S&P 500, itself, that exposes its upswing as fraudulent.
A Small-Cap Conundrum
Data included in the accompanying tables are normally placed in the Green Book’s Appendix, but we added them here to make an important point: Deteriorating market breadth and Small-Cap underperformance are not necessarily the same thing.
A NASDAQ Conundrum
While we have an above-market weight in Technology stocks in our Select Industries portfolio, it’s doubtful that NASDAQ bulls have drawn much inspiration from these pages of late. But here’s a simple finding to potentially rectify that.
Echoes Of 2021
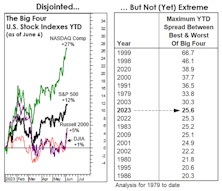
The NY FANG+® Index is up 68% YTD and +21% in the last month, with the Equal-Weighted S&P 500 up less than 2% YTD. Yet a measure of internal market disparity has 2023 barely cracking the top-ten of “incongruent” market years—meaning it can get worse before it gets better.
Youthful Rally Already Looks Old

For more than a year, we’ve characterized the U.S. economy and policymakers’ decisions as increasingly late-cycle in nature, but that probably doesn’t do justice to the U-turn in the investment backdrop.
Stocks Versus “Safe Havens”
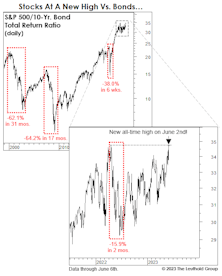
While we aren’t clamoring to add long-term Treasuries in tactical accounts, we believe that the past 18-months’ action has left them more attractive versus stocks than during most of the last 15 years. However, compared to gold, the S&P 500 still trails on a total return basis measured back to Y2K.
Just A Typical Pre-Recessionary Rally?
Is the stock market disconnected from a souring economy? It might seem that way, and the topic dominated the discussion at the recent Market Technicians Association annual symposium.
Revisiting The 1966 Forecast Failure
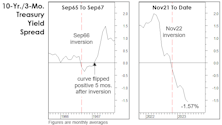
Developments over the last four months leave us even more skeptical that the November yield-curve inversion will join 1966 as a “false positive.” The number one reason being the subsequent shift in the yield curve itself.
Watching The Wealth Effect
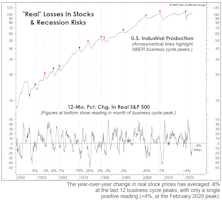
“Real” stock-market wealth has declined considerably since late 2021 without yet delivering a knockout blow. But if the other key evidence detailed throughout this section is on the mark, that wallop is lurking in the very near future.
This Curve Threw Us A Curve...
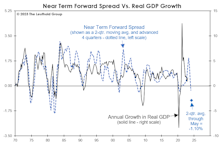
Future economists learning of zero interest rates and Fed balance-sheet expansion during the 2021 inflation surge may wonder if policymakers were “on” something. Jay Powell is clearly “onto” something with his focus on a measure that few are familiar with: the Near-Term Forward Spread (NTFS).
The Pre-Election “Put”

Years preceding presidential elections are more likely than others to feature stock-price action that is favorably disconnected from the fundamentals. Since 1926, the average S&P 500 gain in a pre-election year is +14.2%—about double the next-best year of the cycle.
A Look At Where Rate Hikes Are “Working”

Speculative spirits are back, and the index that’s suddenly close to its 2021 high is the one we viewed as the epicenter of the mania—the NY FANG+® Index!
A Rear-View Peek At The Future
Question: Some tactical managers provide long-term forecasts for stock market total returns (7-10 years or longer). Do you publish such estimates?
Perception for the Professional
May 2026 Issue

Featured Articles
Sector Navigator
May 2026 Issue
