Inside The Stock Market ...trends, cross-currents, and outlook
Even The Labor Market Looks Recessionary
We think the stock market is skating on pre-recessionary thin ice, an endeavor that, admittedly, can be both irresistible and (temporarily) profitable.
Waking From A Slumber?
We’re very skeptical that the rally from last October’s low represents the first leg of new bull market. But if it is—as many believe—then it has unquestionably inherited the worst set of genes we’ve ever observed in the species.
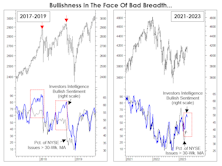
Herd Instinct

Growth and Tech have been the flagrant winners YTD, yet the SVB crisis triggered further bifurcation: Since SVB failed, it’s been important to own only “big” Growth and “big” Technology, amplifying the multiples of monster stocks, like MSFT and AAPL. Can a major market low occur when investors are herded in a handful of the most richly-priced public companies in history?
A Thrust Is Not Enough

The S&P 500 rally off last October’s low reached +16.9% at its peak on February 2nd. That’s well below the largest post-WWII bear-market rally of +24.2%
The “K” Has Been “KO’d”
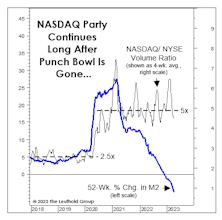
Volcker stormed to the scene to extinguish a blaze lit by others, while Powell battles a conflagration of his own making. Even if Powell executed a perfect, disinflationary soft landing, there may be something else in the cards: The magnitude of M2 shrinkage has resulted in the Marshallian K’s worst ever reading.
Crunched!

We have no special insights into the likely depth or duration of the banking crisis, but the impact on credit has already been severe. That might seal the fate of the economic expansion. It’s worth noting that in 2008, the recession seemed to have “caused” the credit crunch—not the other way around.
Inflation: Following The Script?
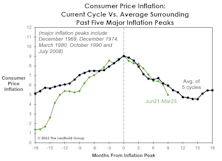
We know that historical analogs and averages can be overdone in market analysis, and our statistical approach (and maybe our longevity) makes us even more susceptible to looking for patterns that might not exist.
A G-Rated Take On Valuations

In the wake of the 2020-21 mania, any dose of valuation sanity is obviously greeted with eye-rolls. We are going out of our way to present the numbers in the least-shocking way possible.
Small Caps Getting Cheaper By The Day
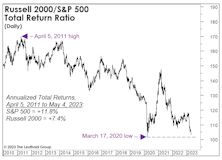
It was September 2020 when we suggested that a new multi-year phase of Small-Cap-stock leadership had begun. Almost immediately, the Russell 2000 reversed a big chunk of the prior decade’s underperformance. Unfortunately, that was the extent of the run.
Small Caps Missed The Memo

For the first time since 1946-47, the super-bullish, six-month window beginning with the mid-term elections through the following April, failed to see a material upswing in Small Caps.
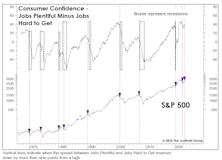
Irrational Optimism?
During bear markets, speculative psychology can remain depressed long enough to have a self-fulfilling impact on the economy. In today’s experience, we expect investors’ economic fears will be “fulfilled” in coming months. In the short term, however, at least one measure of optimism has sprinted out ahead of the stock market itself.
One Of A Kind

Steve Leuthold, the founder of our firm—friend and mentor to everyone on our Leuthold team as well as prior employees of the last 40+ years—passed away last month in Carlsbad, California. He was 85.
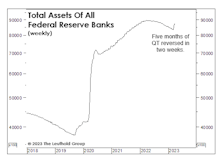
Pause, Then “Paws?”
Despite the Fed’s tough-talk about getting the funds rate above 5%, monetary and liquidity measures are significantly less bearish. Thank SVB depositors, who required a bailout big enough to reverse five months of QT in just two weeks. The market reaction looks like that after September 2019’s Overnight Repo-market turmoil, which forced the Fed to end its first experiment with QT.
What’s “Priced In?”

Could the stock market have already discounted a forthcoming recession?
Was That A Pivot?
Stock market monetary- and liquidity conditions over the last year have been the harshest we’ve seen in a 33-year career, and consistently the largest drag on the Major Trend Index (even overshadowing valuations!).
Something BAA-d Brewing?
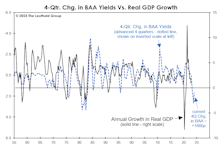
Tightening peaked in Q4-2022, with the BAA yield at 266 bps above its year-earlier level—the most contractionary move since the early 1980s. If the standard lead-time applies, the full impact will be felt in Q4-2023.
ISM: Down, But Not Out
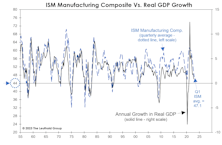
Early evidence shows the recent banking calamity knocked down already-fragile measures of confidence and activity, as exhibited by the ISM Manufacturing Composite posting a fifth-consecutive reading below 50.
Normalizing The Abnormal?
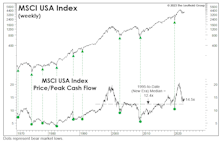
In recent years, we’ve supplemented our longstanding normalized earnings technique with the simpler method of referencing any past peak in EPS (or, for that matter, trailing peaks in other corporate fundamentals, like cash flow and sales per share).
The Cycle That Never Was
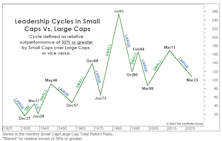
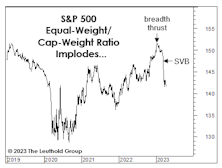
At 144 months, this is now the longest Large-Cap cycle on record, but its dominance will have to prolong to eclipse the second-longest leadership phase (1946-1957), in which Large Caps achieved a 190% performance spread above Small Caps.
QE Fuels Inequality—Even Among Stocks
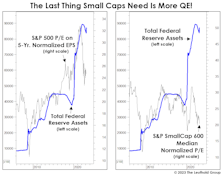
We don’t know enough about banking-system mechanics to conclude if the Fed’s balance-sheet increase associated with March’s bank bailout constitutes a new round of QE. But if it is, we’re skeptical equity investors should celebrate it. In fact, those running Small-Cap portfolios should probably fear it!
Perception for the Professional
May 2026 Issue

Featured Articles
Sector Navigator
May 2026 Issue
