Inside The Stock Market ...trends, cross-currents, and outlook
The Rally: Impressive, But Not Yet “Thrust-Worthy”
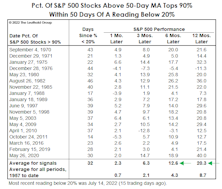
Many technicians contend that the rebound off June’s lows triggered a bear-market-killing “breadth thrust.” Several gauges we monitor to capture this phenomenon contradict that claim. None has reached a threshold that is extreme enough to qualify as a thrust.
Multi-Asset: Winning By Losing Less
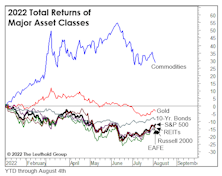
At the beginning of the year, we liked the chances for the “Donut Portfolio” to break its 10-year losing streak against the S&P 500. As a refresher, the Donut holds six of seven key assets in equal weights. The S&P 500 is excluded—a decision probably only suitable for allocators who are self-employed.
Break Out The Checkbook!
We apologize for that terribly misleading teaser of a title, but the bills for the stock-market mania of 2020-2021 are piling up. Inflation is one of them, lately increasing each month as relentlessly as cable TV used to. And for the 10% of households who own 90% of the stocks, market air-pockets such as June’s are like “surprise” medical bills: There’s rarely just one
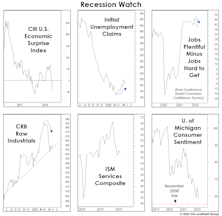
More Signs Of Peak Inflation
As suggested in our June 24th, Chart of the Week, the peak in consumer inflation (+8.6% in May) has likely either occurred or is imminent. Consumers should thank the stock market, which in 2022 has taken up its occasional role as inflation-fighter after the Fed abdicated throughout 2021.
Looking “Bustier?”
Key indicators are indeed trending in “pre-recessionary” fashion. Among them is the ISM New Orders Index, which dipped into contraction territory in June while inventories increased. Others are the JOLTS that shows a strong (but weakening) labor market, and unemployment claims—which have ticked up.
A Morsel For The Bulls

The MTI’s Technical category is still decisively negative at -3, but some of its shorter-term “counter-trend” components look intriguing for the first time in 2022’s entire decline.
“Recessionary” Valuations?
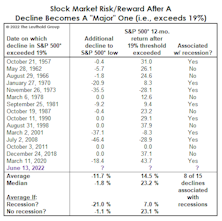
The bear was a mere cub back in March when we examined the historical record of buying S&P 500 dips in the -10% to -12% range. “Blindly” buying them turned out to have mediocre returns, but we illustrated that the positions of various business-cycle indicators could help one determine whether or not catching the proverbial “falling knife” was warranted.
Down—But Not Washed Out

Based on a short-term perspective, stocks may be ripe for a bounce. However, the S&P 500 has not reached “oversold” territory since early 2016, and it is still a long way from doing so. Of the major indexes, only the Russell 2000 is now positioning to soon claim a “low-risk buy” signal.
How It Is—And Isn’t—Like Y2K
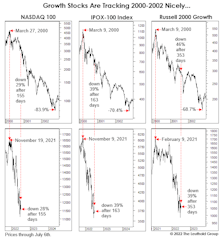
We previously promised to limit the amount of comparisons to Y2K, but the paths that a number of the usual suspects are taking look more and more like “something we’ve seen before”—in some cases down to the percentage point.
Time Cycles Got It Right; What Do They Say Now?

The enormity of the preceding mania and its vicious unwind have us believing the current bear could unfold over a much lengthier time than is typical. But a combo of time cycles suggests a major low is due any time.
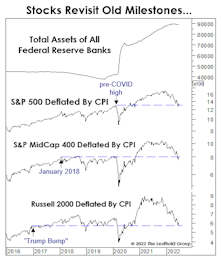
Remember When?
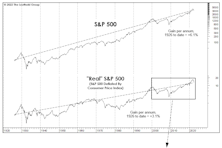
Remember the good old days (like even a year ago) when one didn’t need to mentally tabulate investment results in inflation-adjusted terms? For a blissful couple of decades, nominal and real returns were so close together that the latter figure seemed irrelevant.
Sentimental Musings
Most sentiment measures show none of the frothiness that lingered in the months after the Y2K Tech bust. Rather, some exhibit actions reminiscent of early 2008.
Watching The “Smart Money”
Of the prevailing bullish arguments, the one that strikes us as the weakest is that there’s “too much pessimism.” Much like in 2000, some pundits disingenuously made that claim before the market rolled over. But at this point, with the market now down big and economic numbers suddenly wobbly, the last thing any bull should want is too much pessimism.
A Morsel For The Bulls
The MTI’s Technical category is still decisively negative at -3, but some of its shorter-term “counter-trend” components look intriguing for the first time in 2022’s entire decline. In particular, we’re watching the behavior of a group of indicators that performed brilliantly near the bull market highs.
A Market That Defies Description

We’re sure that it’s not lost on our readers, but the stock market loves to toy with people. The dollar costs of a decline and the opportunity lost from misplayed manias are bad enough. This particular market, though, seems to take offense when you merely try to label it. Correction or bear? The debate rages on, even though the flagship fund of the lone equity manager who’s a household name is down 75% from its peak—and still raking in money!
No Time To Dance
No one wants to be this cycle’s Chuck Prince. In June 2007, the Citigroup CEO said, “As long as the music’s playing, you’ve got to get up and dance.” (Fifteen years later, when one Googles his name, “music playing” is what auto-fills.)
2022 Versus Y2K
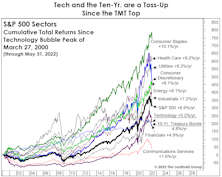
The dot-com bust was so long ago, most are likely unaware just how catastrophic the long-term Tech-stock returns are when measured back to March 2000. Technology has been the third-worst sector performer on a cumulative basis through May 2022; its +5.2% return has barely beaten 10-year Treasuries.
Should An Inflation Peak Be “Bought?”
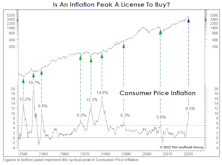
Many economists recommend equity investors to instinctively and aggressively “buy” the inflation peak. History is on their side, though not as overwhelmingly as they might believe.
The Housing Market Is A Trip!
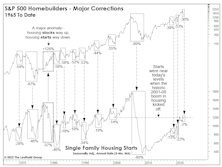
In mid-May, S&P 500 Homebuilders officially became a COVID “round-tripper”: After a one-month COVID collapse of 53% and an ensuing rally of almost 250%, this year’s selloff drove Homebuilders to a May 11th close that was a few ticks below its pre-COVID high. Imagine what might happen if the housing market cracks?
Your “Free Lunch” Comes With A Tab
The market impact from money printing has been underwhelming when adjusted for the inflation it’s unleashed. Measured from the peaks associated with the first attempt at Quantitative Tightening, in inflation-adjusted terms, Small Caps, EAFE, and Emerging Markets all have losses.
Perception for the Professional
May 2026 Issue

Featured Articles
Sector Navigator
May 2026 Issue
