Inside The Stock Market ...trends, cross-currents, and outlook
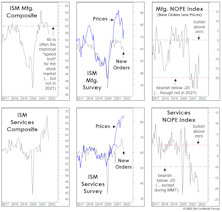
“Gapping” Lower?
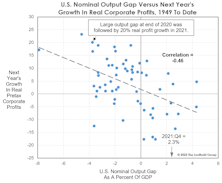
NIPA’s “all-economy” profit margin declined a bit in Q4—which typically peaks before SPX profits—and that falloff coincided with the economy officially reaching full employment, based on the CBO’s Nominal GDP Output Gap. When the Output Gap has flipped positive (like in Q4), corporate profit margins usually come under immediate pressure.
Cycles: A Key “Window” Is Approaching

Next month kicks off the seasonally-weak phase of the stock market’s Annual Cycle: May-October. Overlaid on that is the statistically vulnerable stretch of the four-year Election Cycle: the “mid-point” of the Mid-Term Year. There’s a positive way to spin this mid-term malaise: The cycles imply that an ideal window for a major low is about to open.
Zigs And “Zags”
Like Gonzaga in the NCAA basketball tournament, stock market bulls are set for their first real test in a very long time.
Isn’t That Super?

Washed-out investor sentiment and “oversold” stock market oscillators are usually good reasons to get more invested in stocks. But in the case of super-oversold conditions, it is commonly a forewarning that another wave of selling is yet to come.
Reversion, But To Where?
The concept of “mean reversion” used to help build massive fortunes. Of late, a better mantra has been “maximum attraction,” as valuations and bullish psychology have matched or surpassed excesses of the Y2K Tech bubble. Meanwhile, corporate profit margins, once dubbed “the most mean-reverting series in finance” by Jeremy Grantham, have now topped those seen near the Y2K top by more than 50%.
Market Gets A Speeding Ticket
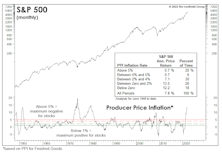
PPI and CPI inflation reached levels that were “too hot to handle” last April and July, respectively, yet the blue chips kept going up through year-end. Large Cap investors who trimmed stocks in response to the violation of these long-time inflation speed limits, however, haven’t missed out on much, and Small Cap investors who did so are happy.
Inflation: More Lighter Fluid!
For months, we’ve argued there are two ways of thinking about the current economic cycle. Economist types are likely to side with their brethren at the NBER, who say the recovery has entered its 23rd month. But those observing the broad range of economic and financial gauges might view this cycle as a single economic expansion dating back to mid-2009.
Sentiment: Why The Long Faces?
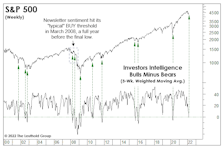
Those who want validation to buy aggressively with the market down 10% can reference two historically reliable, intermediate-term sentiment measures with fresh BUY signals—and there’s a third one that’s also very close to triggering a BUY. The problem is that boundaries defining extreme psychology change over time—with a key inflection occurring as the market transitions from bull to bear.
Too Early To Buy?
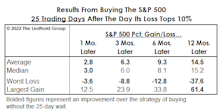
Many investors will instinctively salivate at lower prices, whether or not they represent good value. Is there a better way to temper this Pavlovian impulse and improve results? We found it’s better to wait 25 days before re-entering the market after a 10%-correction threshold is breached.
A 2% Yield Is Higher Than You Think

Prior to the Russian invasion of Ukraine, 10-year Treasury yields bumped above 2% for the first time since July 2019. While that level may strike seasoned investors as insanely low, a 2% yield is now within a few basis points of the ten-year moving average of 2.04%.
Don’t Fight The Tape?
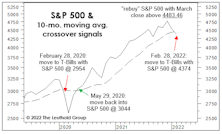
Longstanding concerns over the stock market’s lofty price tag are frequently dismissed with the observation that “valuations are not helpful timing tools.” We don’t disagree. In that spirit, then, let’s review three simple trend-following models that have been useful timing tools.
“Collared” By The Fed?
In late January, the S&P 500 was down so much (almost 10%!) that it revived talk of investors’ favorite “safe” security. No, not T-bills—and not even Amazon or Apple common stock—but the Fed “put.” Years ago, we called it the “hypothetical” Fed put. But by now, we’re believers.
A Failure of "Free Money"
Senator Rand Paul’s annual “Festivus” report on wasteful spending makes for sobering reading to the dwindling few who care about federal finances. The “low light” for 2021 was a $465,000 grant to the National Institute of Health for a study of pigeons playing slot machines.
“Plotting” The Course For 2022
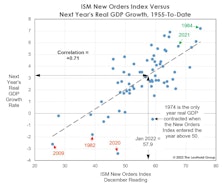
The economic expansion officially entered its 22nd month in February. In dog years, that translates to an age of 13—the same age the recovery might have reached this July if not for the COVID disruption. The late-cycle characteristics displayed by a recovery that’s statistically so young dissuade us from issuing a high-conviction forecast for 2022.
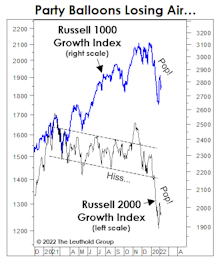
Easy Money? Not In Small Caps

One might have predicted that big beneficiaries of war-time-style levels of federal spending, financed by money printing, would be Small Cap stocks. And from March 2020 until March 2021, they were. But the larger picture is sobering.
Two Ways To Spin The Russell 2000 “Bear Market”
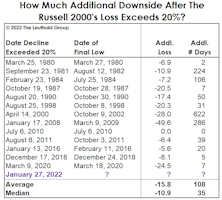
At the market’s January 27th close, the headline blared, “Russell 2000 Enters Bear Market.” Well, not exactly. If one accepts that a 20% decline constitutes a bear market, then the bear actually began on November 9, 2021—the day after the Russell 2000 peak.
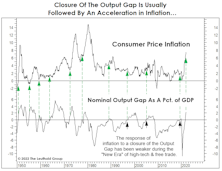
Speed Trap Ahead?
In San Francisco, thefts of less than $950 have been decriminalized, while in Minneapolis, police are so beleaguered that car thefts not involving injury are ignored. Is it any wonder that the economy felt free to violate its usual stock market “speed limits” throughout much of 2021?
What “Causes” Inflation To Decline?
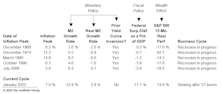
Last year’s consensus view that inflation would prove “transitory” missed the mark. There’s no reason for shame; inflation forecasting hadn’t been a required investment skill for the previous 30 years.
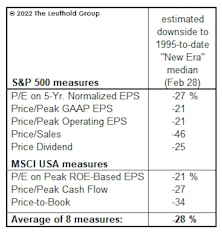
Bubble Or Not? Two Valuation Takes
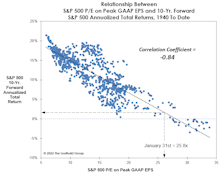
In early 2018, we thought the market was expensive, but certainly not a bubble. Today, the trouble is not just high P/E multiples, but the sustainability of the “E” itself—with profit margins nearly 20% higher than ever before. Whether one believes U.S. Large Caps are engulfed in a bubble or not, we have a P/E ratio for you.
Hello To The Roaring Thirties?!
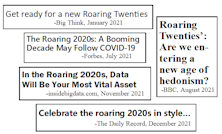
The ink hadn’t dried on 2020’s PPP checks when pundits began speculating that the new decade could be a repeat of last century’s “Roaring Twenties.” That’s become a popular view after a booming 5.7% real GDP growth and a nearly 30% stock market gain in 2021. Just how popular? Analysts are already extrapolating their bullish views into the 2030s!
Perception for the Professional
May 2026 Issue

Featured Articles
Sector Navigator
May 2026 Issue
