Inside The Stock Market ...trends, cross-currents, and outlook
A Good Year For Cheapskates
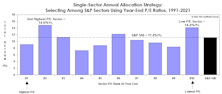
For our more fundamentally-oriented readers who are repulsed by all this talk of momentum, we have an alternative. Just forget about performance and focus solely on value!
Cheapest Sector Track Record
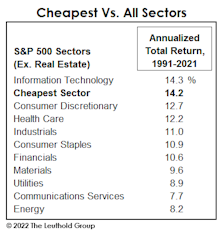
With the 2020 Bridesmaid Asset Class (Small Caps) and Bridesmaid Sector (Consumer Discretionary) underperforming in 2021, the Cheapest Sector results in 2021 salvaged a bit of pride for the author of this annual evaluation. Even better, owners of the Financials sector won’t need to send the government its share of their long-term capital gains, since they’ll be holding it for another twelve months.
“Peak Insanity” Is Behind Us
We think 2021 has earned its place in the books as the wildest and most speculative year in U.S. stock-market history, eclipsing even 1929 and 1999. That doesn’t mean 2022 will bring a panic or a crash, maybe just a degree of sobriety.
“Memes” Need Money Growth...
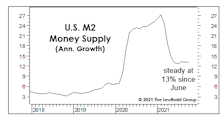
The extra months of QE “auto-pilot” failed to support some of the themes we’d have thought were the most likely to benefit from it—including IPOs, SPACs, Bitcoin, and the sky-high growers favored by the ARK Innovation ETF. Instead, the smart play with each of these assets was to ignore the ever-expanding Fed balance sheet and sell in February.
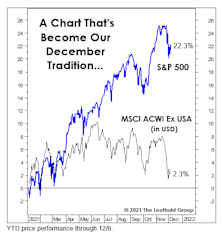
Our Annual Lament On Foreign Equities
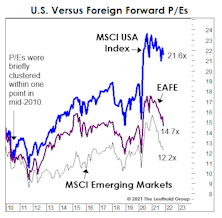
There should be a name for the syndrome suffered by foreign stock investors over the last decade or so. “Groundhog Day” doesn’t quite cut it, because that event repeats only once a year. It seems like this time of year we always feature a chart showing a healthy YTD double-digit gain in the S&P 500, along with a bond-like gain in EAFE, and a bond-like gain or loss in the MSCI Emerging Markets Index.
Full Employment Brings Margin Risks
How high can corporate profit margins go? The third quarter saw a new record of 11.0% in NIPA “all economy” after-tax margins, and figures for the S&P 500, due out in a few weeks, will also set a record.
Is Powell A “Phillips Curve” Guy?
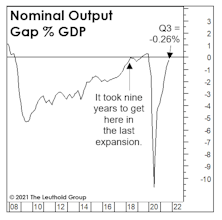
With consumer price inflation raging at 6.2% and few indications of an imminent rollover, Jay Powell has waved the white flag and retired the ill-begotten “transitory” descriptor. The timing of Powell’s concession is intriguing—perhaps he’s a fellow follower of a simple inflation model: the Output Gap.
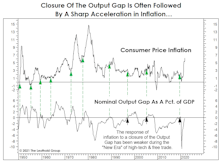
A 2023 Inflation Peak?
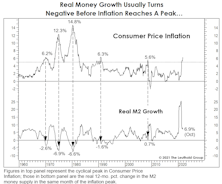
We don’t profess to be professional inflation forecasters, but are struck by a sort of “temporal” mismatch in the arguments used by those who believed the inflation pick up would be temporary. Specifically, the most commonly-cited bullish inflation arguments have been secular in nature, based on long-term trends in technological innovation, demographics, and free trade.
An Inflationary Wealth Effect
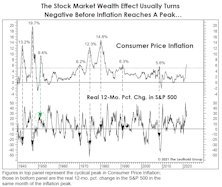
Causation between the economy and financial markets is never a clear thing. The optimistic group formerly known as “Team Transitory” believes a peak in the inflation rate is near, presumably clearing the way for even greater P/E multiple expansion than already seen in this cycle.
The Thirteen-Year Earnings Upcycle
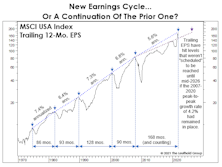
The NBER informs us that the economic expansion is only in its sixth quarter. That’s good to know, but we don’t think investors should be positioned nearly as aggressively as such a statistically-youthful recovery would normally mandate.
Party Like It’s 2029?
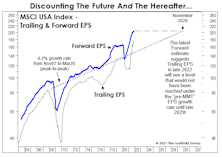
Trailing EPS that the Street now expects for the twelve months ending November 2022 would not have been achieved until November 2029 if the pre-COVID trend-line EPS growth rate had remained intact throughout the current decade.
Commodities Cooling In 2022?

It’s easy to misread where the true “consensus” stands on any financial forecast. Here’s a disconnect we see in current consensus thought: The “crowd” seems broadly bullish on commodities, yet the same crowd (previously known as Team Transitory) thinks consumer price inflation is near a cycle high.
The Donut: A Not-So-Healthy Snack

In April, we suggested that an antidote for high valuations on the S&P 500 might be an extra bite or two of the “Donut” Portfolio—an equal-weighed portfolio of several of the usual asset allocation suspects excluding the S&P 500. That proved to be good advice for about two months.
Aging Prematurely
Regardless of one’s view on the maturity of today’s economic and market cycles, it’s hard to deny that the continuation of extraordinarily-loose economic policies is now causing those cycles to age prematurely. And no doubt it’s contributing to the premature “graying” of many market participants.
No Bark, No Bite?
If NBER is correct that a new economic expansion began in mid-2020, then this cycle is unfolding in “dog years.” After limiting between-meal snacks earlier this year, champion-breeder Jay Powell has informed his pack of canines that their portions will also be reduced as of later this month.
The State Of The “Tape,” Before The Taper
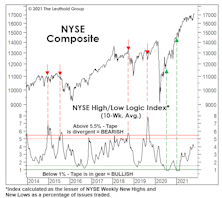
Technical types who have the luxury of avoiding the worsening valuation, inflation, and liquidity backdrop probably view today’s market as a much “safer” one than has existed for many months, now that breadth and leadership cracks have been mostly sealed up.
Manufacturing: More Citations For Speeding
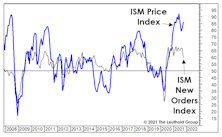
It is much easier to predict inflation, itself, than to predict when investors will become traumatized by it. Some of the most helpful measures for the latter task come from the ISM Manufacturing Report. October’s readings saw three key measures above the statistical “speed limits” we calculated years ago.
“Into The Weeds” With Normalized EPS
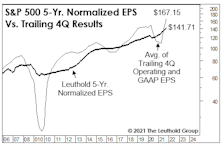
The environment where massively above-trend federal outlays have generated massively above-trend readings in both current and projected S&P 500 EPS, the idea of normalizing EPS over a period as long as five years might seem hopelessly out of touch. But it’s during times of extraordinary conditions—both good and bad—that render this work especially valuable.
A Marginal Measure Of Margins?
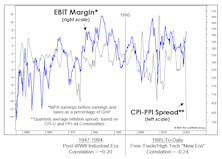
For those believers in a new economic- and stock-market era, there’s good news. The CPI-PPI spread has not been an effective proxy for profit margins during the 1995-to-date “New Era.” But, the failure of an inflation measure during a mostly non-inflationary era shouldn’t come as a surprise.
It’s That Time Of Year…
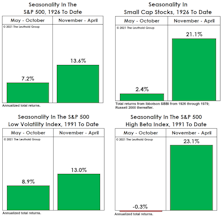
October’s nearly +7% S&P 500 surge was impressive, but came a month early—according to the traditional seasonal cycle—which turned bullish on November 1st, and will remain intact for the next six months.
Perception for the Professional
May 2026 Issue

Featured Articles
Sector Navigator
May 2026 Issue
