Performance
Feeble Bull Or Hibernating Bear?
At last October’s lows, we had yet to see any manner of economic, monetary, and valuation “reset” that would clear the path for a resilient cyclical bull. And, in the 51 weeks since that bottom, U.S. economic, monetary, and valuation conditions have only deteriorated further.
Pause, Or Paws?

The one-year anniversary of the 2022 bear-market low occurs on October 12th, yet—after all this time—we’re not confident enough to declare it as the bull’s first birthday.
We’re interested to see whether or not CBNC breaks out new baseball caps for the occasion, as they did in the late 1990s for “Dow 10,000.”
New Policies, Old Outcome

At long last, we’ve exited an investment world that was defined for more than a decade by zero interest rates and Quantitative Easing. Or so we thought.
Active/Passive: Data Refresh Through Q1-2023

The performance derby between actively managed portfolios and passively managed index funds is a fascinating and important topic in the investment community at large. This note provides a brief update our previous studies through the first quarter of 2023.
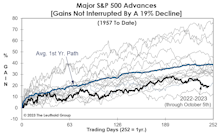
Checking In On The Rally At The Six-Month Point
.jpg?fit=fillmax&w=222&bg=FFFFFF)
Yesterday was the six-month anniversary of the bear market low of 3,577.03 in the S&P 500. We think it’s unlikely the moderate upswing since then represents a new cyclical bull market. However, with the evidence still weighing in at Neutral, we’re not betting the farm on that opinion.
VLT: A Double-Sworded Edge

“Oversold” usually has a positive connotation in financial jargon, yet history’s worst air-pockets have almost always occurred when the stock market was deeply oversold. More time is needed before a “low-risk” entry point for the S&P 500 will be triggered from the VLT’s currently “oversold” status.
Your “Free Lunch” Comes With A Tab
The market impact from money printing has been underwhelming when adjusted for the inflation it’s unleashed. Measured from the peaks associated with the first attempt at Quantitative Tightening, in inflation-adjusted terms, Small Caps, EAFE, and Emerging Markets all have losses.
Digging Out Of The Red
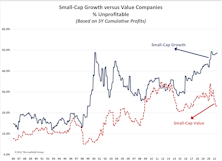
An unprecedented number of companies are still deep in the red, even while the economy is shrugging off the impact of the pandemic. Small-cap growth companies are showing no sign of a quick recovery.
After The SPAC: De-SPAC Performance
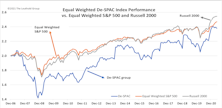
The ultimate measure of a SPAC sponsor’s success is stock performance post merger: De-SPAC results. We analyze historical returns of De-SPACs that had initial market caps greater than $200 million.
A COVID Weight-Loss Program For The 4% Club
.jpg?fit=fillmax&w=222&bg=FFFFFF)
While we’re still squeezing into our pants and fretting over our newest chin, the S&P 500’s three-largest firms have been shedding their COVID-weight gain at a measured pace for months. Whereas most people drop the pounds through vigorous activity, these firms have managed to slim down just by standing still.
Stocks And Yields Revisited
.jpg?fit=fillmax&w=222&bg=FFFFFF)
The S&P 500 and 10-Year Treasury bond yield could accomplish something fairly rare today by closing at “joint” 52-week highs. The relevant levels to meet or exceed are 3934.83 on the S&P 500 and 1.49% on the bond yield.
How It Bodes For Biden

Early evidence suggests the Biden administration and the newly “purple” Senate will resist the pull of the far-left, at least from an economic perspective. Stock investors are cheering... though in light of their current euphoria, they might as well have celebrated a write-in victory for Ralph Nader alongside Green Party control of the Senate.
Bridesmaid Track Record
With last year’s Bridesmaid (REITs) having laid an egg, the long-term “alpha” of the Bridesmaid portfolio narrowed to +3.7% from a bit over +5% (annualized) when we first published this study more than a decade ago.
The Relationship Between ETF Fund Flow & Future Returns
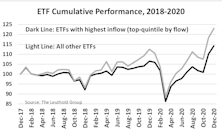
In April 2018, armed with a large number of ETFs and long-enough historical data, we applied our back-testing methodology for individual stocks to the universe of ETFs to determine if the same (or some) of those components could useful for assessing ETF performance prospects. One of the factors we reviewed was fund flow (adjusted by AUM), which revealed that those ETFs experiencing the largest asset inflows proceeded to significantly underperform.
SPACs: More Analysis Of Past Deals

Last month, we briefly discussed a burgeoning investment vehicle—Special Purpose Acquisition Companies (SPACs), also known as “blank-check companies.” Since the sole purpose of a blank-check company is to find an operating business to merge with, and subsequently bring it public, the best method to gain some understanding about the outcome of these relationships is to look at past deals.
After The “Thrust”…

We’re concerned that cyclical groups, which normally catch fire after a breadth thrust, are tracking along the bottom (or below) the previous worst-case outcomes following identical breadth-thrust signals.
Should You Trust The Thrust?

There are two concerns with the latest bullish thrust signal, with one, in part, causing the other. First, the S&P 500 return preceding the MBI thrust signal was +42.8%, almost triple the average slippage of +15% associated with all prior signals.
The Active Goose, The Passive Gander
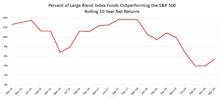
Raise your hand if you’ve heard this one before:
(A) 80% of active funds underperformed their index over the past 10 years.
Now, keep your hand up if you have also heard this:
(C) Therefore, investors should buy passive index funds.
Utilities Sector: What’s Driving YTD Performance?
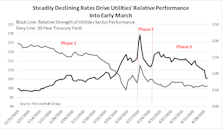
We review the somewhat out-of-character performance of the Utilities sector to try to pinpoint what is influencing results. This article touches on several potential drivers for the sector’s relative strength.
Factor Failure: Don’t Blame FANMAG
_Page_1.jpg?fit=fillmax&w=222&bg=FFFFFF)
Our recent commentary “1” For The Record Books noted that just one of seven S&P smart beta factors was able to outperform the S&P 500 last year, even though each style basket limits its holdings to constituents of the parent index.
Perception for the Professional
March 2026 Issue

Featured Articles
Sector Navigator
March 2026 Issue
