MTI
Breakout Or Fake-Out?
The S&P 500 has fully erased its January and February losses, but there’s probably a market message in the fact that it took so long to do so.
Change In Market Character
The Major Trend Index fell into its negative zone last week and we trimmed the already below-average net equity exposure in tactical accounts by a few more points, to a current 41-42%.
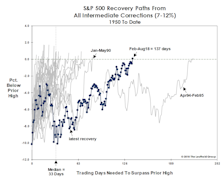
The Correction That Scared No One
The setback from the January 26th market peak represents the ninth correction of 7% or more since 2009, the most ever recorded during a single cyclical bull market.
Most Likely Just A Correction
So, what happened to the January Barometer—the old analyst’s maxim that a market gain in January portends a gain for the full year?
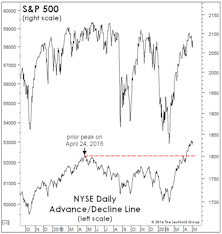
Market Breadth Still Very Robust

Read this week's Major Trend Index.
A “Good Year” To Start The Year
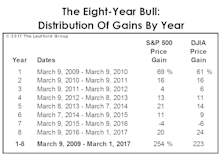
The S&P 500 was up 6.4% YTD through March 3rd, a bit above its average annualized gain of 5.9% since 1926. In other words, 2017 would be a good year if the books were closed today.
MTI Extends Bullish Streak

The Major Trend Index stabilized in a moderately bullish range during the past several weeks.
Only The Shadow Knows

If the above observation from almost a century ago remains on the mark (as it has for almost a century), then both the cyclical bull market and accompanying economic expansion should remain in force during the next several months.
How Will It All End?

Last month we described ourselves as “long on equities, but light on conviction,” and that description still applies.
Rally Extension?
We’ve boosted equity exposure twice in the past several weeks, fully cognizant that it’s not a “textbook” time to do so.
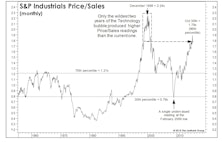
Valuations: The Correction That Never Was
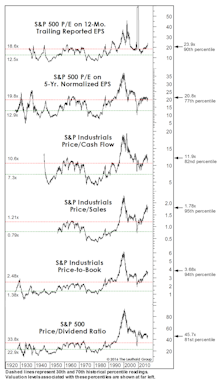
The correction failed to meaningfully “reset” any long-term valuation measures, hence, we don’t view the current environment as having much investment merit, but rather, primarily speculative appeal.
“Four On The Floor”
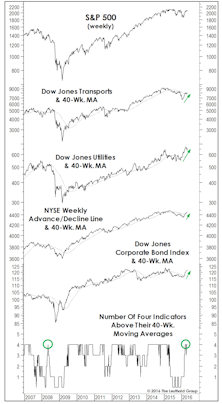
Leadership, breadth, and corporate credit all staged intermediate-term breakouts, rising above their respective 40-week moving averages. In this formation, historically, S&P 500 annualized return is +15%.
Sizing Up The Rally
While our MTI became bullish in mid-April, we can’t rule out that the rebound from February lows could be an impressive bear market rally. However, this rally sports impressive technical credentials.
MTI Now Bullish, But Doubts Linger

The Major Trend Index reverted to its bullish zone in the week ended April 15th, following almost ten months in which the work resided in either neutral or negative territory.
Improving Indicator Evidence
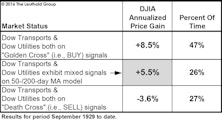
Last spring’s “Double Death Cross” in the Dow Transports and Dow Utilities had been partially reversed even before the February low, when the Dow Utilities’ 50-day moving average crossed above its 200-day moving average (thereby issuing a “Golden Cross”). The Dow Transports remain in a bear pattern based on the 50/200-day relationship, but the gap is closing fast.
Stock Market Observations
The stock market rally off the February 11th lows has been powerful enough to lift the Major Trend Index into its Neutral zone (in fact, a high-neutral ratio of 1.04), and therefore certainly deserves some level of respect.
Has The Hook Been Set?

Two months ago, we suggested a short-term bounce in oil might prove to be the fundamental “hook” that would rationalize a bear market rally. We thought a bounce to $45 might do the trick—and oil futures essentially cooperated, reaching $41.90 on March 22nd.
New Month, Old Worries...

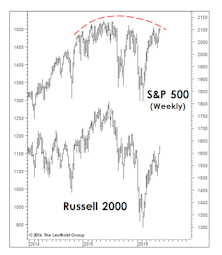
While the S&P 500 had erased all but 2% of its August loss as of early December, Small Caps and the “average stock” had recouped only about half their correction losses. Not good.
To Play The Rally, Or Not To Play?
Question: What will you do if the Major Trend Index returns to its bullish zone?
A Bear Till Proven Otherwise
Major Trend Index remains decisively negative at 0.72. The “market action” category is the primary culprit behind this bearish tally, but we’ve also seen the Economic category deteriorate in recent months and would expect this trend to continue. This sequence is typical: Market action leads economic trends (and, we would argue, is a major cause of those trends).
Perception for the Professional
March 2026 Issue

Featured Articles
Sector Navigator
March 2026 Issue
