Inside The Stock Market ...trends, cross-currents, and outlook
Energy: Kicking A Dog When It’s Down
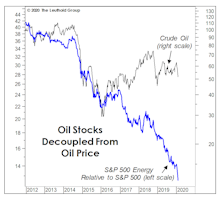
With crude trading at only about half the level seen in the first few years of this expansion, there might be a tendency to view its current price as depressed. But from an inflation-adjusted perspective, today’s price sits right on top of its modern-era (post-embargo) median.
Central Planning Makes A Comeback
Bulls who fashion themselves as contrarians argue that the public is nowhere near as infatuated with the stock market as they were in the late 1990s. It may come as a shock to our readers, but we agree with them.
Index Rebalance Effect—A Disappearing Anomaly?
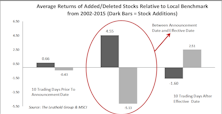
In the past we’ve made the observation that adding/deleting stocks to/from a popular index can have a profound impact on the target stocks’ short-term trading volume and performance.
A New Year, Or A Blast From The Past?
It was during the very first days of the great 2019 market rally that we noted its similarities to the bubbliest of all the bubble years—1999. Wow. We had it in our hands and frittered it away.
A Blast From The Past
With 2020 representing The Leuthold Group’s 40th year of publishing Perception For The Professional, we perused the first few Green Books for relevant nuggets from 1981, but the backdrop could not have been more different. Therefore, we instead turned the clock back 20 years, thinking it might yield insights more resonant with today’s environment.
A Spectacularly Average Thirty Years
In the spirit of good holiday cheer, we made a partial concession to the True Believers with a December “Chart of the Week” in which we narrowed our stock market valuation analysis to the historically elevated levels of last 30 years.
Charts Are In The Eye Of The Beholder
After last year’s 30% S&P 500 gain, many strategists are now suggesting that the real melt-up still lies ahead. We think a melt-up has already occurred, and the bulk of it has been booked.
Waiting For The Stimulus To Trickle Down...
Last year the Federal Reserve dumped historic stimulus onto a full-employment economy and an already richly-valued stock market. The stock market obviously loved it.
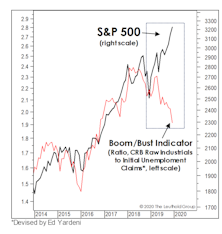
Stocks And GDP

Economists argue the best thing the stock market has going for it is the continuation of the U.S. economic expansion. Maybe.
It’s Not What They Borrowed, But How They Used It
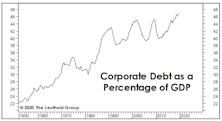
Following the deflationary bust of 2007-2009, the last decade was expected to be one of deleveraging. Only U.S. consumers appeared to get that memo, however.
Are Earnings Set To “Gap” Higher?
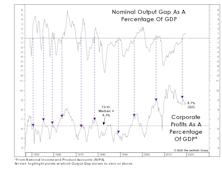
We are troubled that the bullish optimism has spilled over into the 2020 estimates for S&P 500 earnings. Zero growth in 2020 is probably not a bad guess for NIPA figures, but S&P numbers don’t always follow suit.
Inflation: Not “If,” But “Where”
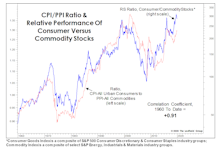
In the aftermath of the Great Financial Crisis, we reminded investors that it would be historically unusual for the thematic leaders of a bull market to repeat as the winners of the subsequent bull.
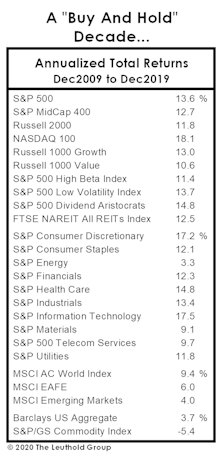
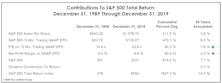
A Good Year To “Own It All”
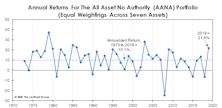
It’s no surprise that U.S. Large Caps were the #1 asset class performer in 2019. We were surprised that last year was the only one of the decade in which the S&P 500 won the annual performance derby. Here we review the annual performance of “Bridesmaid” asset class and sector, “Perfect Foresight,” and Lowest P/E sector.
Rewarding “Perfect Foresight”
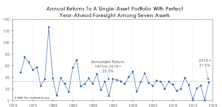
During the first five years of our career, we worked for a group of stockbrokers who, by each year’s end, seemed to have been gifted with perfect foresight on the major asset markets. Admittedly, we never saw their clients’ actual returns.
Momentum Across Asset Classes

For those not blessed with clairvoyant asset selection ability, we’ve developed a simple single-asset portfolio strategy that’s handily beaten the AANA Portfolio and the S&P 500 over the long-term.
Bridesmaid Track Record
Here are the historical annual performance results for the hypothetical Bridesmaid strategy.
Bridesmaid Strategy Risk And Reward
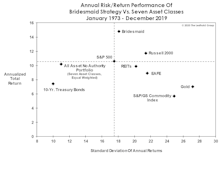
We know that risk measurements have become passé, what with the S&P 500 having annualized at +13.6% in the last decade without a single drop of 20%. But the Bridesmaid strategy looks great relative to the available asset classes on a risk-adjusted basis.
Bridesmaid Strategy For Equity Managers
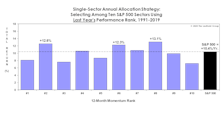
Our work on the Bridesmaid momentum effect dates back to 2006, and was originally based on equity sectors rather than asset classes. Again, the hypothetical approach is to ignore macroeconomic trends, sector fundamentals, valuations, and the like, and to base sector selection solely on the prior year’s sector total return rankings.
Sector Bridesmaid Track Record
2019 was the fourth consecutive year of underperformance by the annual Bridesmaid sector pick. Those poor results have trimmed the annualized “alpha” of the strategy to just +2.2% since 1991.
For Value Investors Only!
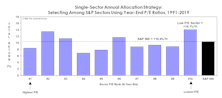
With the possible diminution of “alpha” in price momentum strategies, we recommend that sector allocators consider approaches that are more countertrend or contrarian in nature.
Perception for the Professional
May 2026 Issue

Featured Articles
Sector Navigator
May 2026 Issue
