Inside The Stock Market ...trends, cross-currents, and outlook
Are You “De-Worsified?”

In recent weeks, we’ve seen the “sell-side” investment community get about as cautious as it ever gets, recommending investors to “trim risky holdings on ‘up’ days” and “stay diversified.” However, these cheerleaders’ idea of diversification is usually to hold more equities in different sizes and styles.
Is Passive Ownership Exacerbating The Sell-Off?
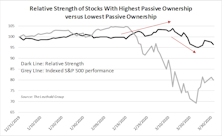
With the enormous popularity of ETFs, we’ve wondered if the high level of passive fund ownership could lead to stock price deviation from company fundamentals, and thus create greater price volatility.
Time To Revisit “Why We Normalize Earnings”
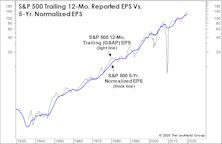
With an economic calamity and the Easter season upon us, we thought this would be a great time to resurrect our “Why We Normalize Earnings” vignette. Long time readers will recognize this as a staple from Green Books’ past.
Milestones, Mayhem, and Miley

If it can recover from its February setbacks, the bull market will turn 11-years-old some time in March, and our Golden Retriever will turn 13 at the end of the month.
Back Breaker?
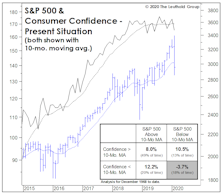
With the wavering state of consumer and business confidence, even a modest stock market correction of 8-10% might deliver the fatal blow to confidence—and therefore to the U.S. economic expansion.
Out Of The Blue?
There have been long-time divergences between blue chips and other market segments signaling that all is not “in gear” beneath the surface—but this cautionary activity never foretells the “timing.” Recently, Small Caps, the Value Line Arithmetic Composite, and Dow Transports staged pathetic bounces off the January 31st “Coronavirus 1.0” low, while the blue chips had strong momentum into mid-February. Normally, such divergences typically last for at least 3-4 months before they become meaningful.
Valuation “Reset?”
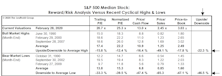
The massive performance dispersion of the past two years makes it difficult (if not hazardous) to draw a simple conclusion about U.S. stock market valuations. But it’s safe to say that cap-weighted indexes like the S&P 500 and S&P Industrial Index remained significantly overvalued at the low point of the February correction.
A Developing Opportunity In The “SMIDs?”
The underperformance of Mid and Small Caps in the last few years has taken valuations from top-decile readings (and, indeed, a few all-time records) just 25 months ago, down to the middle—and even lower reaches—of their 30-year valuation boundaries.
Over-Stimulated?
We can’t count the number of times in the last week we’ve heard analysts worry about “what the Fed might know that we don’t.” In the words of John McEnroe, “You cannot be serious!”
A Real Corona-Crash In Credit
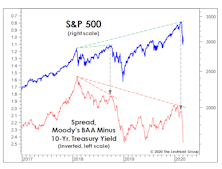
If the U.S. economy falls into recession in the months ahead, it might be the only one in history that will be remembered as having been triggered by a “black swan.”
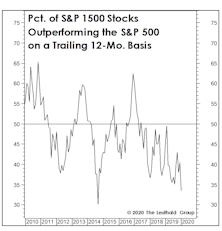
A Signal Bulls Should Love...

There’s no question that it’s been a rough couple of years for stock market technicians. We noted earlier that if February 19th stands as the final high of the bull market, it would be only the third time in the last 100 years that the NYSE Daily Advance/Decline Line failed to provide at least a few months’ advance notice of the oncoming bear.
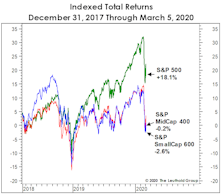
Are You “De-Worsified?”

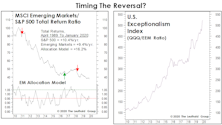
The past 26 months have been wild ones for equity investors, but one could have essentially matched the S&P 500’s healthy return of +18.1% with a portfolio that was evenly split between the “fear” assets of Treasury bonds and gold. REITs have been solid, too, but EAFE and the Russell 2000 are now both total return losers since the beginning of 2018.
“Oversold” Doesn’t Mean “BUY”

In difficult market periods, Steve Leuthold liked to distinguish between conventionally oversold markets and those that had become “Jesus Christ oversold.” Recent action clearly qualifies as the latter. There are many ways to define a “dangerously” oversold condition, but the one that always raises our antenna is now flashing extreme selling pressure that might take longer than usual to mitigate.
Enhancing Country Rotation With Sector Concentrations

A dramatic shift of country weights within EM indexes has become an inadvertent challenge for a country rotation strategy. Due to this, we tested the integration of a momentum-based sector rotation model to attain exposure to the top-rated sectors to represent the markets of the largest country components instead of seeking to obtain “whole market” exposure.
The Alternate Ending?
After last year’s spectacularly successful pivot following the December 2018 plunge, the thinking is that future rate hikes are the bull market’s only threat. Perhaps that will be the case; the belief is certainly well-supported by postwar U.S. economic history, but it also reveals a shocking lapse in short-term memory.
Superhuman Feats Got Us Here
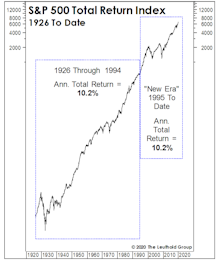
The simultaneous “New Era” ascension in margins and P/E ratios hasn’t generated anything exceptional from a return perspective. To the contrary, annualized S&P 500 total returns over this 25-year period of margin magic and (mostly) escalating P/E ratios merely match “Old Era” returns.
Liquidity Overflow!
Based largely on the bearish trends in our monetary and liquidity measures, we were correctly negative on stocks throughout most of 2018. It’s therefore especially painful for us that 2019’s market rebound has been credited almost entirely to the “pivot” in most of those measures.
Parabolic Prescience?
Market bulls rightly note that in the late 1990s, dozens of stocks exhibited Tesla-like action before the fun eventually came to an end. But we’d remind investors that the last few years have featured other “busted parabolics,” and all of them were followed in short order by broader market troubles.
Keep Some Powder Dry
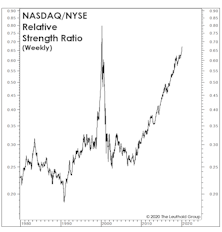
We’ve discussed market analogies with the year 1999 at length, and will give it a rest for awhile—in part because parallels to the year 2000 have cropped up! In the first five weeks of 2020, the NASDAQ 100 has already outperformed the NYSE Composite by about 7%, while in the first five weeks of 2000 the spread was 8%.
EM Equity Purgatory
Nine months ago we established a “pilot” position of 4% in Emerging Market equities in the Leuthold Core Fund, based mostly on the bullish inflection in a long-term technical indicator (VLT Momentum).
Perception for the Professional
May 2026 Issue

Featured Articles
Sector Navigator
May 2026 Issue
