Inside The Stock Market ...trends, cross-currents, and outlook
“Quant Quake” But No Market Quake

Value, High Beta, and Small Cap stocks all captured a few rays of sunlight for the first time in a long while. It’s too early to tell if last month’s leadership U-turns can be sustained, but major market trends are the most susceptible to reverse during cyclical bear markets.
Where Would You Rather Be?
On October 3rd, the S&P 500 briefly traded below the high it made in January 2018 before reversing to close the day higher.
Small Cap VLT BUY: Not Quite...

Small Caps came tantalizingly close to activating a major VLT BUY signal in September, with the Russell 2000 closing less than a half percent below the trigger level. A new bull signal from this indicator wouldn’t “fit” into our market and economic narrative, but we won’t sweep it under the rug if it occurs.
Making Money In The Money-Losers

Despite an economy operating “beyond” full employment for the past seven quarters, more than one-fourth of the companies in the Leuthold 3000 universe are losing money on a 12-month trailing basis. The Fed has subsidized what’s truly become irresponsible behavior.
The Trend Is Your “Fiend!”

Over the last year of market swings, we’ve tracked the horrific performance of what had previously been a solid long-term system for timing the S&P 500, the 10-month moving average crossover system. In the last 12 months, this generally low-risk approach has generated a total return loss of 13.74%.
More Trends We Don’t Find Friendly…
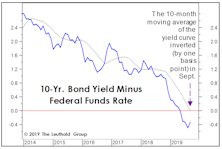
The yield curve’s ten-month moving average inverted in September, hence the yield curve inversion can no longer be dismissed as transitory; the Boom/Bust Indicator remains below its descending 10-month moving average, confirming economic weakness predicted by the yield curve; and, the “Present Situation” component of September’s Consumer Confidence survey slipped below its 10-month moving average for the third time in 2019.
More Yield Curve Musings

The U.S. yield curve inversion has lasted long enough that even a few economic optimists now concede it will ultimately prove significant.
Last Bastion Breaking Down?
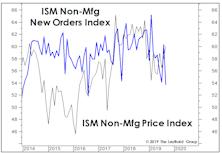
We’ve been expecting weakness in the manufacturing sector to spread to the service economy, but were not prepared for the nearly four-point drop in the latest ISM Non-Manufacturing Composite. We don’t want to overplay a single monthly reading from an historically volatile report, but the Non-Manufacturing Price Index spiked despite the drop in New Orders.
Credit Cracking?
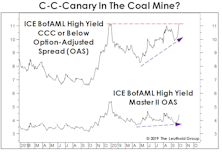
One of the key pillars of the bullish case has been the supposedly “benign” trend in corporate credit. While that’s been true for holders of the popular junk bond ETFs (HYG and JNK), the broader credit picture is not as reassuring.
Quality Stocks’ Stronghold

Despite higher volatility, market performance is still up in the high double-digits YTD. Interestingly, as our index of High Quality Stocks versus Low Quality Stocks shows, High Quality is prevailing in terms of relative performance.
We’re All Economists Now!
It’s now been more than 19 months since global stocks peaked on January 26th, 2018. Those lucky enough to have been invested solely in the S&P 500 and to have held on for the volatile ride have a 3.7% gain to show for it. Nice going.
More Extreme Than 1999?
We noted that the December 2018 stock market low was the second most expensive in history, second only to that of October 1998. Similarities between 2019 market action and the 1998-99 rebound remain eerie. Something isn’t right, and it’s not bullish.
ISM Shows This Is A Different Kind Of Cycle
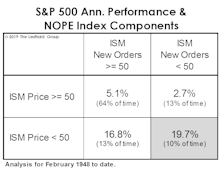
The manufacturing economy has thrown us a deflationary curve in 2019: The Price Index broke down in advance of New Orders, a reversal of the textbook recession/recovery sequence between these two measures.
Monetary Madness
We always do our own work and draw our own conclusions. Lately, though, we’ve wondered what the late “Monetary Marty” Zweig might say about the stock market’s current liquidity backdrop.
Pricing In “Peak” EPS
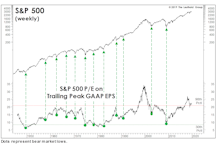
A recent theme in our valuation work is that we no longer need to assume a full-blown “reversion to the mean” to illustrate current U.S. stock market risks: Even a reversion to “old” bull market highs in ratios like S&P 500 Price/Sales, Price/Cash Flow, and Normalized P/E would result in bear-sized losses.
“Too Smooth” Of A Ride?

While investors in Value, Small Caps, and especially foreign stocks might beg to disagree, a key MTI technical measure suggests this decade’s stock-market ride has been almost entirely “pain free.”
Small Caps: “What If?”

The Russell 2000 is the most important major index on the cusp of a new BUY signal. Our best guess is that Small Caps will still trend lower for now, creating a buying opportunity in the months ahead.
Commodity Stocks: “Low” But Not Cheap
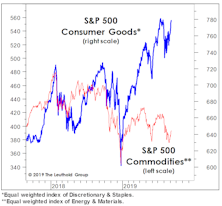
A general rule of thumb for thematic equity investors is that the dominant leadership sectors and groups in a given bull market normally don’t repeat as leaders in the subsequent bull.
A Final Warning

This Stock Market section’s unifying theme has been that of an historically two-tiered market, one in which Domestic, Large Cap, Growth, Consumer-oriented, and Low Volatility stocks have reigned supreme.
Worrisome Profitability Trend Among Small Cap Companies
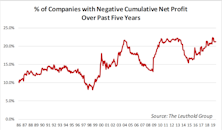
Despite a historic economic expansion during the past decade, there is an ever-increasing number of companies that are finding profitability has become harder to achieve.
Perception for the Professional
May 2026 Issue

Featured Articles
Sector Navigator
May 2026 Issue
