Inside The Stock Market ...trends, cross-currents, and outlook
Are You Really A Contrarian?
The need to sound contrarian has become a borderline obsession among market pundits. Media opportunities for talking heads have exploded in the last decade, forcing those who hold the safest consensus views to falsely portray themselves as lonely and misunderstood market mavericks.
August Is No Time To Disconnect
Rather than stocks disconnecting from the economy, as some equity bears contend, we see the blue chips disconnecting from the rest of the market. The underperformance of leading groups, along with multimonth divergences in momentum, bullish sentiment, and credit spreads are all consistent with the deteriorating prospects for earnings and the economy.
Who Doesn’t Love “Excess” Money?
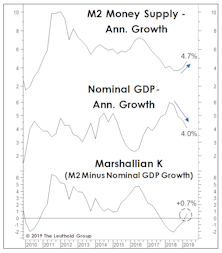
We’d concede the monetary backdrop for stocks is now mixed, an upgrade from the almost uniformly negative environment of last fall. On the negative side, the U.S. yield curve inversion has now persisted long enough that even the economic optimists are getting nervous.
Low Vol For All Seasons?

The early August setback took the S&P 500 below its late-January 2018 high—and the time when we first trimmed net equity exposure in Leuthold tactical funds from a nearly fully-invested posture.
The Fed Subsidy Is Wearing Off

Earnings results for the second quarter have so far "beaten" expectations (as they always seem to), but that hasn’t changed the calculus for Small Cap companies. About one-third of them have negative earnings over the last twelve months.
Altitudes And Attitudes

Trend followers who use the ten-month moving average discipline finally had a positive month in July. But after the early-August decline, they are still holding an S&P 500 loss of 60 points from their latest trade initiated at the end of June.
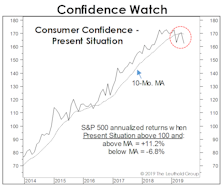
Consumer Vulnerability
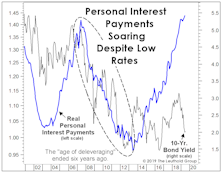
While re-leveraging of the U.S. corporate sector during this economic cycle has been well-documented, the common belief is that the consumer balance sheet remains in good shape. That’s technically true.
Assessing The Commodity Free-Fall

For at least two years, the unofficial title of “the scariest chart in the Leuthold database” belonged to the S&P 500 Price/Sales ratio. That chart still rattles us, with the July month-end ratio still in the vicinity of its old Y2K high.
Odds & Ends
Here are some brief follow-up notes on topics covered in recent months’ Green Books.
Seeking Yield Among ETFs

The 2.00%-4.99% yield range is the sweet spot for yield investors from a risk/reward standpoint; while the other end of the spectrum (>5% yield) incurs too much risk for the fat payouts. Here we spotlight four ETF strategies that focus on dividend paying stocks.
Mid-Year Mea Culpa
The S&P 500 has rallied 9.2% in the 22 trading days since its June 3rd low, but the move hasn’t (yet) been enough to lift the Major Trend Index out of its negative zone.
Recession Evidence: How Much Is Enough?
Over a 12-month horizon, we now believe a U.S. recession is very likely, but aren’t confident enough to make the call when the forecast window is cut in half. Second-half stock returns could be decent if the business-cycle peak is still a year away. Then again, there’s peril in waiting for “too much” confirmation of recession.
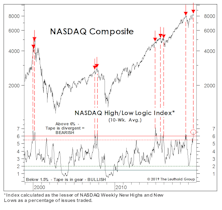
Breadth: Is It Different This Time?
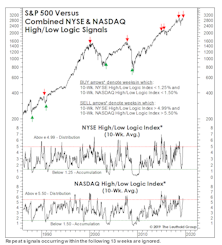
The granddaddy of all technical indicators—the NYSE Daily Advance/Decline Line—continues to make new highs alongside the S&P 500, suggesting the market should move to even higher (but perhaps narrower) highs well into the fall. As noted a month ago, we increasingly suspect that granddaddy may be telling a lie.
Big Is Still Beautiful
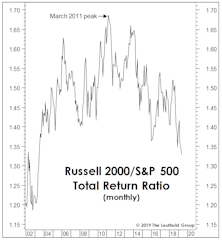
The 10-year-old bull grabs most of the headlines, but its younger sibling has begun to command more respect.
Reliving ‘99... Tick By Tick

Current leadership trends continue to track their 1998-99 behavior in an almost eerie fashion—so much so that we now wish we’d used that historical period as our instruction manual!
Building The Wall?
One of the more impressive feats that bullish pundits have pulled off is their successful portrayal of themselves as lonely and misunderstand contrarians even as the eleventh year of a cyclical bull market grinds on.
Does BUY Now Mean SELL?

Many technicians consider the 10-month moving-average crossover technique as the gold standard among long-term timing practices. The method was successfully applied to several asset classes in the SSRN’s most-downloaded paper of all time, “A Quantitative Approach To Asset Allocation” by Meb Faber.
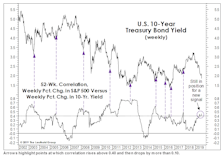
Correlations Are Worthless, Except This One
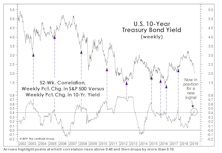
We’ve never understood investment quants’ desire to project correlations among assets. Such correlations are inherently unstable.
Return Implications Of Dividend Cuts
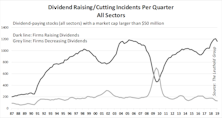
Last month we noted that current interest-rate expectations might indicate good timing for dividend investments; however, we strongly suggested being selective, and lean toward high-quality dividend payers.
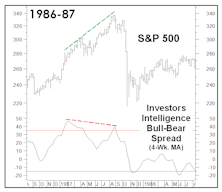
Still Tracing Out A Top
Major market tops are drawn-out processes that can prove costly, and infuriating, to bulls and bears alike. Younger readers might be surprised to know that was true before Twitter.
Perception for the Professional
May 2026 Issue

Featured Articles
Sector Navigator
May 2026 Issue
