Inside The Stock Market ...trends, cross-currents, and outlook
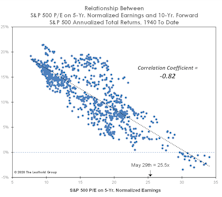
Low Single Digits?
We encourage diversity of thought in our shop, but even pessimists among our ranks have a hard time making the case for a ten-year negative return for U.S. stocks, which was recently predicted by the founder of a large hedge fund.
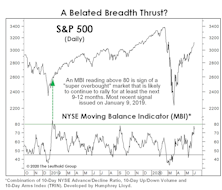
Should You Trust The Thrust?

There are two concerns with the latest bullish thrust signal, with one, in part, causing the other. First, the S&P 500 return preceding the MBI thrust signal was +42.8%, almost triple the average slippage of +15% associated with all prior signals.
The “Next Big Thing” May Not Be Big
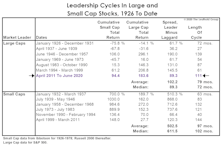
There’s one trend that’s lasted almost as long as the bull market and economic expansion and it hasn’t definitively come to an end. The current Large Cap Leadership Cycle hit the nine-year mark in April.
How Much For Your “Free Lunch?”
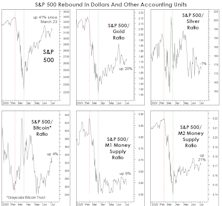
The 41% S&P 500 rally would be half as large if measured in terms of gold, and a “unit” of the S&P 500 now buys 70% fewer ounces of gold than it did in early 2000. Meanwhile, when denominated in either silver or Bitcoin, the stock market rally has been almost nonexistent.
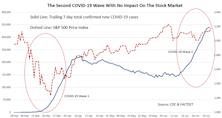
Commodity Comeback?
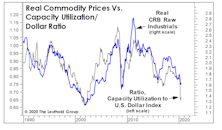
Many analysts thought the last cycle would end with a bit of “fire” in the form of higher commodity and consumer prices, and they might well argue they would have been right if not for the eruption of COVID-19.
The High/Low Says “Buy High!”
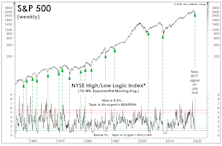
We’ve written periodically about the likely distortion of market breadth figures resulting from High Frequency Trading, the domination of ETFs, and (we believe, most importantly) the decimalization of stock quotations. Our concerns led us to expand our technical arsenal, and one of the gems we uncovered in that process was the High/Low Logic Index (HLLI).
Stimulus Gone Wild!
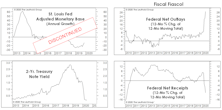
Market perma-bulls deserve high marks for their persistence, yet, despite all that’s transpired in 2020, their case is exactly the same as six months ago: Extreme stimulus won’t “allow” a significant stock market drop, nor any further economic deterioration.
A Stock Market Brain Teaser
The bull and bear labels can be dangerous to stock market operators, so much so that famed speculator Jesse Livermore is said to have abandoned them in favor of softer terminology: “Lines of least resistance.” We aren’t about to ditch the old labels, or even our collection of bull and bear bookends.
Revenge Of The Nerds?
Last month we detailed two technical shortcomings of the rally off the March 23rd market low. The stock market duly noted our critique and has issued its response.
“Not Quite” Super

The average “super-overbought” MBI reading occurred 54 days after a market low; June 4th marks the 51st trading day since the March 23rd low. Thus, any signal in the days ahead would arrive essentially “on time,” but the slippage (the S&P 500 gain already realized) would be enormous at around 40%!
“Normalizing” For The Earnings Collapse
Stocks (and more specifically, U.S. blue chips) did not fully (nor even approximately) discount the economic calamity. The result is that, in just over two months, the “baby bull”—if that’s what it is—has achieved what took his legendary predecessor more than eight years to accomplish: Top 25x on our Normalized P/E.
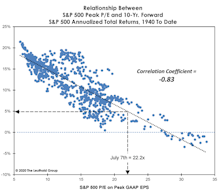
“Peaking” Into The Future
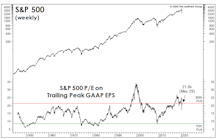
Peak P/E has just moved into its top decile on a postwar basis. If the recent rally is indeed the first roar of a new bull, then this is a bull that’s a “baby” on a calendar basis, but quite elderly from a “character” perspective.
The Wrong Kind Of “Head Start”
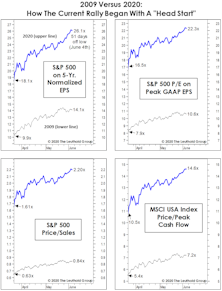
The rally’s initial resemblance to the first up-leg off the secular 2009 market bottom is remarkable. Both rallies started in March, and achieved gains of almost 40% within 50 trading days. Both, of course, sprung from a backdrop of unprecedented monetary stimulus.
A Bear That Left VLT Unscathed?
Our VLT Momentum algorithm was driven into oversold territory for at least a few months in all prior postwar bears. It didn’t happen yet this spring, which implies that the “grieving process” was neither deep enough nor long-lasting enough to set the stage for anything like a repeat of last decade’s bull. Most of our valuation work says exactly the same thing.
A Long Boom, And The Ultimate Bust
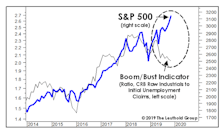
Last December, we marveled at the disconnect between the (surging) S&P 500 and the (sagging) Boom/Bust Indicator. Just six months later, we can only scratch our heads at what the hell we were complaining about.
Sentimental Musings
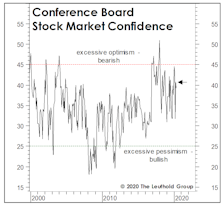
Long-term sentiment indicators have carved out a four-month pattern similar to what we’ve observed in Large Cap valuation measures. That’s no surprise; valuation is a sentiment measure.
The Money Supply Isn’t Magic

Imagine our surprise when the bullish stock market narrative is suddenly all about money. Cynically, though, that might be because money supply and the unemployment rate are the only economic data series staging upside breakouts, and the latter doesn’t lend itself to a good narrative.
Money Losers Among Small-Cap Growth

Late last year, we presented data showing that profitability has become more elusive for small companies despite a record-long period of economic expansion. We discussed the potential causes underlying this phenomenon.
There’s More To It Than That

It’s a down year for stocks, yet John Bogle must still be chuckling. A full-employment economy that had propped up one of the two most overvalued stock markets in U.S. history just suffered a cataclysmic “sudden stop.” Yet Bogle’s buy-and-hold disciplines have so far dodged the bear.
Perception for the Professional
May 2026 Issue

Featured Articles
Sector Navigator
May 2026 Issue
