Inside The Stock Market ...trends, cross-currents, and outlook
Rewarding “Perfect Foresight”
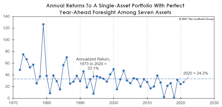
The AANA Portfolio could be viewed as representing one extreme of the asset allocation continuum—in which no knowledge of comparative asset valuations or economic conditions is assumed (or, at least, imparted). At the opposite pole would be the clairvoyant speculator who puts all of his or her eggs into one basket and holds that basket for the entire year.
Momentum Across Asset Classes
In the extreme case where one possesses no other information beyond last year’s total returns, the best single-asset strategy has been to buy the second-best performer (the “Bridesmaid”) and hold it for the next twelve months in hopes that the prior year’s momentum will carry it through. That approach has beaten the S&P 500 by 3.7% annualized over the past 48 years.
Bridesmaid Track Record
With last year’s Bridesmaid (REITs) having laid an egg, the long-term “alpha” of the Bridesmaid portfolio narrowed to +3.7% from a bit over +5% (annualized) when we first published this study more than a decade ago.
Bridesmaid Strategy Risk And Reward
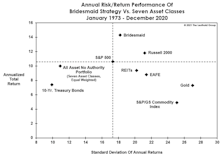
“Risk-adjusted returns” were all the rage after the Great Financial Crisis. Now that such returns are likely to become relevant again, naturally, there’s little scrutiny of them.
Bridesmaid Strategy For Equity Managers
Our work on the annual “momentum effect” dates back 15 years, and was originally based on equity sectors rather than asset classes. The hypothetical approach is to entirely dispense macroeconomic trends, sector fundamentals, and valuations, and base the allocation decision exclusively on momentum.
Sector Bridesmaid Track Record
We’ve worried over the last several years whether momentum and other “alpha” factors have become exploited to the point of diminishing returns. It’s an arms race out there...
For Value Investors Only!
With the Bridesmaid approach we’re attempting to capture “stealthy momentum,” rather than pure momentum. Fundamentalists—and especially value investors—might find that to be a distinction without a difference.
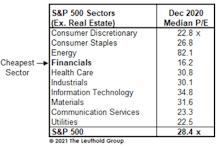
Low P/E Track Record
Financials was the “cheapest sector” in each of the last three years, and its significant underperformance versus the S&P 500 has shaved the historical “alpha” from this strategy. Still, those souls who’ve had the stomach to own the Low P/E sector each year have beaten the S&P 500 by 2.9% per annum since 1991.
The Relationship Between ETF Fund Flow & Future Returns
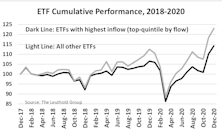
In April 2018, armed with a large number of ETFs and long-enough historical data, we applied our back-testing methodology for individual stocks to the universe of ETFs to determine if the same (or some) of those components could useful for assessing ETF performance prospects. One of the factors we reviewed was fund flow (adjusted by AUM), which revealed that those ETFs experiencing the largest asset inflows proceeded to significantly underperform.
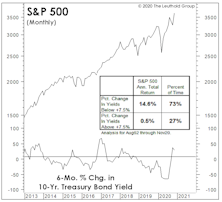
A “Fed” Conundrum
“Don’t fight the Fed” has been great advice for stock market investors over the last nine months. For 2021, that won’t cut it. It should be: “Don’t believe the Fed.”
Wall Of Worry?!?
Many pundits argue that sky-high valuations on stay-at-home stocks “prove” equity investors somehow remain fearful. It’s a nuanced, short-term argument, and there’s merit to it: We’d argue such fears have produced terrific relative values among “SMID” Cap stocks.
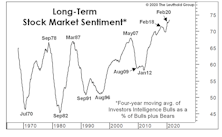
Everything’s Great, And Everyone Knows It
The “Biden Bump” brushed away any lingering technical deficiencies in the stock market, but that happy state of affairs is reflected in extremely frothy-looking short-term sentiment indictors. We are riding the momentum to some extent, but with a lower base-level of exposure.
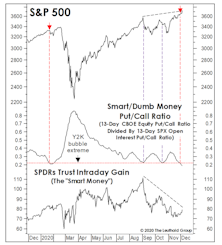
High Tide?
For almost nine months, an historic Fed liquidity flood has washed away any economic, valuation, technical, or “sentimental” stock market challenges. Nonetheless, each economic disappointment brings hope this flood will intensify. Those hopes aren’t irrational, because when it comes to any measure of liquidity, rate of change is more important than level.
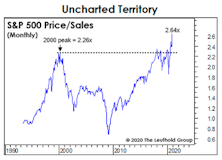
Super-Rarified Air

The 2020 post-election stock surge looks and feels a lot like the 2016 “Trump Bump.” But, of course there’s a spoiler. The Biden Bump started with a Normalized P/E level about 30% higher than the one prevailing on election eve of 2016 (26.8x versus 20.5x, respectively).
Just A “Small” Beginning...
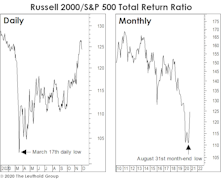
Knee-jerk contrarians are already claiming the stampede in Small Cap stocks is “too consensus” to continue in the near term. We couldn’t disagree more. In fact, we are very confident that a new multi-year Small Cap leadership cycle has kicked off.
A 40-Year Inflationary Echo
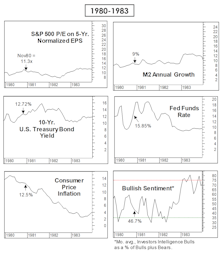
When measured by the gains in stocks, gold, and house prices, there has been just one other occasion in which asset inflation was as “broad” as today—late 1980. But the differences in underlying fundamentals between then and now couldn’t be more stark.
A Great Profit Quarter Was “In The Bag”
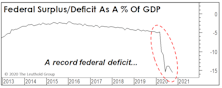
Economists marveled at the rebound in third-quarter NIPA corporate profits to new all-time highs, but it’s just “bean bag” economics from more than a century ago.
November’s Giant “Low Quality Stock” Rally
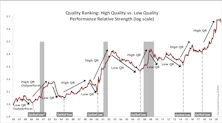
While quant managers watched their factors failing one by one, and market bears stared at the tape in disbelief, the number of retail investors continued to multiply and we witnessed a dramatic performance advantage for low quality stocks. Are we entering a prolonged “junk-rally” cycle?
Remembering Trump

Donald Trump will be remembered as the most polarizing political figure in U.S. history, but he was an unwitting consensus-builder on an issue that was long thought to be “settled science.”
Don’t Overplay The Election
The lack of a “Blue Wave” doesn’t undermine our belief that a big stock market rotation is underway. The valuation gap between Large Cap Growth and other U.S. (and foreign) market segments is so large that it’s become unsustainable.
Perception for the Professional
May 2026 Issue

Featured Articles
Sector Navigator
May 2026 Issue
