Chart Of The Week
Where's The "Meme" Reversion?
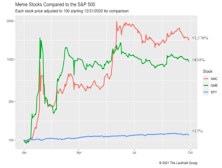
The recent bout of market turbulence has taken a little shine off of the two most famous meme stocks. Still, the elevated levels at which both AMC and GameStop trade can be described as nothing short of spectacular.
The EPS Recovery And "The Cycle"
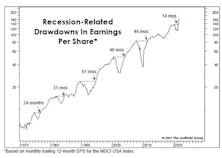
In a couple of weeks, final second quarter EPS for the S&P 500 will confirm the fastest recovery ever from a recession-related earnings decline. That’s old news, and before it has even hit the tape. But we’ve had a sneak peak from the monthly, 12-month trailing EPS numbers published by MSCI for its USA Large Cap Index. Those figures showed that EPS exceeded their pre-COVID peak in May, and the latest reading (through August) is already 22% above the prior high! Simple trendline analysis suggests that EPS for U.S. Large Caps are likely higher today than they would have been in the absence of the COVID pandemic and hyper-stimulative response.
Why Is Confidence “Inverted?”

Stimulus and soaring stock prices have contributed to the fastest consumer-confidence rebound of any economic recovery on record. Yet the manner in which this bounce has unfolded is anything but “early cycle.”
Value Turns Discerning
.jpg?fit=fillmax&w=222&bg=FFFFFF)
The weakness in Value* over the last few months has gotten a lot of attention (Chart 1). While we are still on board with the “Value trade” in general, a subtle but distinct change within the theme has emerged. There is a clear bid for Quality, which had not happened in the massive post-Covid junk rally until recently.
The 2021 EPS Rocket Ship
.jpg?fit=fillmax&w=222&bg=FFFFFF)
If you want to see a rocket ship, there’s no need to crane your neck upwards to see the latest exploits of our billionaire space cowboys. Rather, look to our earnings glidepath chart and marvel at the contrails of the 2021 full year operating earnings for the S&P 500.
It’s Not “Whether” You Sold In May, It’s “What”
.jpg?fit=fillmax&w=222&bg=FFFFFF)
Those who heeded the old advice to “Sell In May” have missed out on an additional 5% gain (and counting) so far in 2021. However, the best way to have played this seasonal anomaly over the years was not to have “sold-out,” but rather to have “reduced the beta” of one’s equity holdings versus cutting equity exposure outright. That strategy has paid-off handsomely the last three months, even as this “Nothin’ Matters And What If It Did” stock-market powers higher.
A Closer Look At The “Rule Of Twenty”
.jpg?fit=fillmax&w=222&bg=FFFFFF)
Inflation and its potential impact on the stock market is the topic du jour, resurrecting ideas that were in vogue 30- to 40-years ago.
Steve Leuthold’s 1980 book, The Myths of Inflation and Investing, provided an exhaustive review of the evidence. But for lighter reading, more appropriate for a summer Friday, we revisit the “Rule of Twenty” developed by strategist Jim Moltz in the early 1980s.
Visualizing U.S. Stock Market Dominance
.jpg?fit=fillmax&w=222&bg=FFFFFF)
It’s near the year’s mid-point and U.S. equities are doing what they’ve done nearly every year since the onset of the Great Financial Crisis: trouncing their foreign counterparts. The S&P 500’s YTD gain of 13.5% is about 500 basis points better than EAFE’s, and 800 basis points above that of the MSCI Emerging Markets Index.
Price to Book: Obsolete, Or Just Misunderstood?
.jpg?fit=fillmax&w=222&bg=FFFFFF)
The Value style has broadly underperformed for more than ten years, and the blame for this dismal decade has often been placed squarely on the Price to Book metric. Could it be that Price to Book’s sullied reputation is undeserved?
Stock/Bond Disconnect?
.jpg?fit=fillmax&w=222&bg=FFFFFF)
In the May Green Book, and again in the May 21st issue of “Chart of the Week,” we discussed the trailing one-year correlation between weekly percentage changes in the S&P 500 and the 10-year Treasury bond yield. Rollovers from high levels in this correlation have signaled most of the important pullbacks in the bond market over the last 20 years.
Real Yields: Interesting, But Not So Helpful
.jpg?fit=fillmax&w=222&bg=FFFFFF)
After Consumer Price Inflation spiked to a 12 1/2-year high of 4.2% in April, there’s been a torrent of analysis decrying the collapse of “real yields”—including the real Treasury-bond yield, real S&P 500 dividend yield, and even the real S&P 500 earnings yield. Since all of these yields already traded at extremely low nominal levels, the inflation adjustment makes every one of them look even worse. For example, the real yield on 10-year Treasuries just sunk to -2.60%, the lowest reading since 1980 (Chart 1).
What The Two-Month Stall In Bond Yields Tells Us
.jpg?fit=fillmax&w=222&bg=FFFFFF)
The 10-year Treasury yield has absorbed the past two months’ worsening inflation numbers by going exactly “nowhere.” Bond investors seem to be all-in on the Fed thesis that the inflation pickup is just transitory.
During the recent consolidation, however, the Treasury yield showed a subtle change in character—one that suggests there might be more inflation paranoia than meets the eye. The 10-year yield’s daily correlation with stock price movements flipped negative, and then plummeted toward a 21-year low.
Active Vs. Passive Return Drivers March 2021 Update
.jpg?fit=fillmax&w=222&bg=FFFFFF)
Our ongoing research into the relative performance of active vs. passive styles reveals that market conditions play a significant role in the active/passive return cycle. We identified a set of metrics that describe the market conditions we believe influence which management style is more likely to outperform. This note updates our data through March 2021.
A COVID Weight-Loss Program For The 4% Club
.jpg?fit=fillmax&w=222&bg=FFFFFF)
While we’re still squeezing into our pants and fretting over our newest chin, the S&P 500’s three-largest firms have been shedding their COVID-weight gain at a measured pace for months. Whereas most people drop the pounds through vigorous activity, these firms have managed to slim down just by standing still.
Earnings Are Back In Focus
.jpg?fit=fillmax&w=222&bg=FFFFFF)
Earnings releases (ER) are normally accompanied by large stock-price movements, either to the upside or downside.
Here, we computed the percentage of companies that registered a large move in their stock price on their ER day in the trailing three-month window (500 basis points up OR down). In order to normalize for non ER-day volatility, we computed the percentage of all companies that registered a significant price move on any day during the same period. The difference between the two is shown in Chart 1.
How Much Inflation Is Too Much? It’s A Moving Target
.jpg?fit=fillmax&w=222&bg=FFFFFF)
In the latest Green Book, we noted that Producer Price Inflation does not usually become a challenge for the stock market until its annual rate breaks above 4.0%. The day that comment was published, the year-over-year gain in the March PPI for Finished Goods spiked to 6.0%, thanks mostly to the well-celebrated COVID-19 anniversary-effect.
Industry Group Dreams & Nightmares—The Bear Market Edition
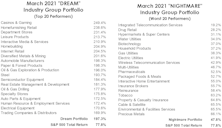
Given that we've recently passed the one-year anniversary of the bear-market bottom of March 2020, we thought it might be interesting to apply our annual Dream/Nightmare exercise to periods following bear-market lows; the idea here being that a major market bottom may serve as a “reset” for new industry trends.
Our Most Contrarian Industry Group Ideas
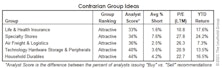
Contrarian investing is difficult from both an emotional and implementation standpoint. Often the consensus is right, and industry groups are out-of-favor for a reason. As the saying goes, “Don’t be contrarian just for the sake of being a contrarian.”
Momentum: “New Junk” In The “Old Trunk”
.png?fit=fillmax&w=222&bg=FFFFFF)
March 23rd marked the one-year anniversary of the COVID-19 bear-market bottom. We are all eager to turn the page on the pandemic ordeal and move forward to brighter days ahead. Looks like some big help is coming our way.
A Flight Of Wee Dragons
.jpg?fit=fillmax&w=222&bg=FFFFFF)
In our mid-month Of Special Interest, “Valuation Extremes: Here Be Dragons,” we examined valuation outliers as a measure of market sentiment. The hypothesis was that exuberance is reflected in investors’ willingness to hold stocks priced on an aggressive “vision” of the future; companies that are either habitually unprofitable or trade at a Price/Sales ratio above 15x.
Perception for the Professional
May 2026 Issue

Featured Articles
Sector Navigator
May 2026 Issue
