Chart Of The Week
2020 Earnings And The Extremophile Market
.jpg?fit=fillmax&w=222&bg=FFFFFF)
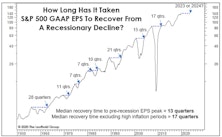
As we wade into the waters of second-quarter earnings, muddied by economic shutdowns and suspended guidance, we thought it might be a good exercise to pull back from the “micro” of firm-level beats and misses and examine the “macro” picture that is the Great Earnings Washout of 2020.
The Growth Style’s Twin Peaks
_0.jpg?fit=fillmax&w=222&bg=FFFFFF)
The strong market rebound in the second quarter lifted the relative return of Growth vs. Value to an all-time high by the end of June. Chart 1 reveals that the cumulative S&P 500 Growth / Value return spread hit a new record last month, surpassing the previous high reached at the end of the Tech bubble in June 2000.
Should You Trust The Thrust?

During the first two months of the rally (and +30%) off the March lows, we noted that the usual cyclical leaders of a new bull market were underperforming on a relative basis, and there had been nothing even close to the “breadth thrust” that often accompanies an initial bull market up-leg.
It’s Demographics, Stupid! (Not The Economy.)
_Page_1.jpg?fit=fillmax&w=222&bg=FFFFFF)
Turn on financial television at any random time, and you’re likely to soon hear the argument that still-high U.S. stock market valuations are “justified” by extremely-low interest rates. We’ve countered that these low U.S. rates are simply a reflection of the secular slowdown in economic and earnings growth.
Keep An Eye On What Your Stocks Will Buy
.jpg?fit=fillmax&w=222&bg=FFFFFF)
News that the Bureau of Labor Statistics may have undercounted the May unemployment rate by six percentage points should remind investors of the danger of taking government economic reports too seriously. Regardless of the figure, though, unemployment is no doubt near its peak for the downturn.
Can The Rally Recover From Its 0-For-8 Start?

The current rally is either the first upleg of a new bull market, or the second-largest bear market rally in the last 125 years. The lone development that can settle the issue is for the S&P 500 to move above its February 19th closing high of 3,386.15.
The Chart Everyone Missed
.jpg?fit=fillmax&w=222&bg=FFFFFF)
When we first met Steve Leuthold in the old company office in a renovated warehouse, he was updating a several-foot-long chart of either the DJIA or S&P 500, by hand, and we got a brief lecture on the importance of using logarithmic scale on price charts.
A “May Day” Revolution?
.jpg?fit=fillmax&w=222&bg=FFFFFF)
With May Day marches and demonstrations cancelled, the workers of the world have one less opportunity to remind us of the ever-widening wealth gap and the evils of the “Top 1%.” It’s a shame, because this was the year that we active managers would have stood shoulder to shoulder with those protesters voicing our own contempt for the “Top 1%”… of the S&P 500.
This Bounce Lacks “Oomph”
.jpg?fit=fillmax&w=222&bg=FFFFFF)
Through last night’s close, the S&P 500 had gained 25.0% in exactly one month. Impressive, but a bit superficial. Anyone running active equity portfolios recognizes the breadth of this move has been unusually narrow.
Sentiment Has Been Crushed, But Might Need To Just Languish For A While
.jpg?fit=fillmax&w=222&bg=FFFFFF)
We didn’t see the coronavirus coming and, like millions or perhaps billions of others, underestimated its likely economic impact when it began to spread. But stock market risks were high well before the virus hit.
Remembering Another “March Milestone”
.jpg?fit=fillmax&w=222&bg=FFFFFF)
While the bull didn’t live to see his 11th birthday, this month did mark the anniversary of another historic event: Twenty years ago this week saw the peak bubble-era close in the S&P 500 of 1,527.46.
Valuations: A “Progress” Report
.jpg?fit=fillmax&w=222&bg=FFFFFF)
As deep as the losses in the DJIA and S&P 500 have been, most professional investors recognize that those averages have masked the extent of the damage suffered by most stocks.
How Sharp Is This Falling Knife?
.jpg?fit=fillmax&w=222&bg=FFFFFF)
While it’s possible that Monday’s S&P 500 low of 2,386 will represent an important trading low, we believe it is too early to expect the market to form a major bear market low.
Better Than Bonds And An All-Time Record
.jpg?fit=fillmax&w=222&bg=FFFFFF)
The collapse of U.S. Treasury yields and the simultaneous end of the bull market has produced a new all-time record for the S&P 500, albeit under less-than-desirable circumstances.
Let’s Concentrate For A Moment
.jpg?fit=fillmax&w=222&bg=FFFFFF)
In the immortal words of Lloyd Bridges, “Looks like I picked the wrong week to quit drinking.” Let’s put aside this week’s market turmoil and concentrate for a moment on... “concentration.” Market concentration, that is. Close your eyes and think back to those carefree days of mid-February.
Factor Failure: Don’t Blame FANMAG
_Page_1.jpg?fit=fillmax&w=222&bg=FFFFFF)
Our recent commentary “1” For The Record Books noted that just one of seven S&P smart beta factors was able to outperform the S&P 500 last year, even though each style basket limits its holdings to constituents of the parent index.
The Easy Fed and the “Other” Inequality
.jpg?fit=fillmax&w=222&bg=FFFFFF)
Super-easy monetary policy has been blamed for the rise in income and wealth inequality in recent years, and more recently we’d fault the Fed for performance inequality within the stock market.
“1” For The Record Books
.jpg?fit=fillmax&w=222&bg=FFFFFF)
Dark energy makes up 68% of the universe, yet astrophysicists are having a devil of a time explaining what it is, why it is, or how it works. Quant investors are facing their own dark-energy mystery in understanding style returns of 2019.
What’s Embedded In The Consensus?
.jpg?fit=fillmax&w=222&bg=FFFFFF)
Market momentum now seems to outweigh simple math in the minds of most investors, and we are not entirely immune. Today our tactical funds are positioned with net equity exposure of 50%, the midpoint of the normal 30-70% range. That’s a higher allocation than if we considered only business cycle dynamics and equity valuations.
Perception for the Professional
May 2026 Issue

Featured Articles
Sector Navigator
May 2026 Issue
