Chart Of The Week
A Chart You’ll Never See Again
 .jpg?fit=fillmax&w=222&bg=FFFFFF)
We’d like to remind readers that forwarding our research to unauthorized recipients is a serious offense. That’s especially the case when the recipient happens to be a U.S. economic policymaker.
The Stock Market Is Trading Like Trump’s A Democrat!
.jpg?fit=fillmax&w=222&bg=FFFFFF)
Around the time of Donald Trump’s inauguration in January 2017, we observed that prevailing valuations argued against him witnessing big stock market gains during his first term.
Closing The Books On Another “1999”
It’s been a while since we looked at 2019’s stock market parallels to 1999. Sorry about that… we’ve been too busy reliving 1999 on almost a daily basis, and often not in a good way.
Valuations: An Updated “Modern” Take
.jpg?fit=fillmax&w=222&bg=FFFFFF)
An occasional critique of our valuation work is that we consider “too much” market history to form a judgment as to what constitutes “high” or “low.” This type of feedback declined during and after the financial crisis (when historic valuation thresholds were temporarily revisited), but it has become more pointed as the U.S. market has soared to new highs.
How Much Should We Pay For Market Momentum?
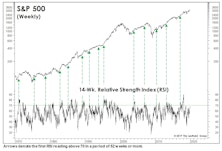
If the S&P 500 closes in the green today, an RSI "overbought" signal will be triggered.
AAPL—The Trillion Dollar “Itsy-Bitsy Spider”
.jpg?fit=fillmax&w=222&bg=FFFFFF)
OK, OK–maybe Apple isn’t so “Itsy Bitsy.” However, when viewed through the lens of our “4% Club” vignette, the stock has certainly followed the Sisyphean pattern of that popular nursery rhyme (and accompanying fingerplay, of course) over the last seven-plus years.
Questioning The Monetary Rebound
.jpg?fit=fillmax&w=222&bg=FFFFFF)
This year’s upswing in money-supply growth has been one of many factors that’s prevented our economic work from triggering a recession warning. Following a two-year decline, year-over-year growth in M2 bottomed near 3% late in 2018 and has trended upward all year, reaching 6.7% in the latest week (Chart 1).
The Market Puzzle Gets Even More Complicated

At last night’s close, the Russell 2000 generated a “low-risk” BUY signal on our Very Long Term (VLT) Momentum algorithm, a possibility we’d alluded to in the September and October Green Books.
Low Rates Don’t Justify Higher P/E Ratios (And U.S. Investors Should Be Glad)

The fear (or hope) that U.S. bond yields would fall to zero or below subsided over the last month. However, the belief that low yields merit significantly above-average P/E ratios remains stronger than ever.
Giving Up The Ghost
.jpg?fit=fillmax&w=222&bg=FFFFFF)
The approach of Halloween brings thoughts of jack-o-lanterns, scary movies, and buckets full of candy. The season also marks the time when investors finally give up the ghost on the optimistic, even wishful, earnings forecasts made early in the year.
If Your Team Is Out Of The Playoffs, Here’s A New Gamble
.jpg?fit=fillmax&w=222&bg=FFFFFF)
With promised breakthroughs on Brexit and the trade war miraculously occurring on the same day, few pundits now believe the market is anywhere close to an important peak. (A peak in the S&P 500, that is, since peaks occurred long ago in the ACWI, MSCI Emerging Markets, NYSE Composite, Value Line Arithmetic, S&P MidCap 400, and the Russell 2000.)
The Odd Couple
.jpg?fit=fillmax&w=222&bg=FFFFFF)
The Momentum style—in which investors buy what has been going up recently—represents an optimistic, hopeful, “I’ll take some of that” mentality. The Low Volatility factor entails a pessimistic, fearful outlook in which investors want (or need) to stay invested in stocks but desire downside protection in case the market performs badly.
Box Jumpers Beware!
.jpg?fit=fillmax&w=222&bg=FFFFFF)
Style rotation! Regime change! Market action of the first two weeks of September coaxed the few remaining Small Cap Value managers off ledges from New York to San Francisco.
Is The Patient Too Old For A Transplant?
.jpg?fit=fillmax&w=222&bg=FFFFFF)
This week’s massive stock market leadership flip has certainly remedied some of the breadth weakness we discussed in this month’s Green Book. But we can’t help wonder whether the move is analogous to performing a transplant on a 95-year-old. The patient might survive the surgery, then die while under anesthetic.
Is A Strengthening Dollar A Form Of Policy Tightening?
.jpg?fit=fillmax&w=222&bg=FFFFFF)
Executive summary (for those leaving early for the holiday weekend): No.
We’ve found no reliable relationship between swings in the U.S. Dollar and subsequent variations in U.S. economic growth.
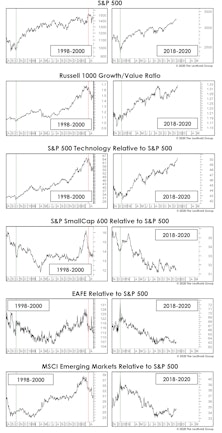
Portraits Of A Split Market
.jpg?fit=fillmax&w=222&bg=FFFFFF)
There’s an old Wall Street adage: “When the wind blows hard enough, even the turkeys fly.” A sophisticated meteorological instrument known as the “price chart” says the wind died down considerably beginning in January 2018
Here’s One Reason Sentiment Is So Subdued...
.jpg?fit=fillmax&w=222&bg=FFFFFF)
Market bulls remain mystified by the lack of enthusiasm for stocks given the proximity of U.S. indexes to all-time highs. They view this relative indifference as a contrarian positive—the “wall of worry” argument.
The Stock Market’s Clark Kent
.jpg?fit=fillmax&w=222&bg=FFFFFF)
Mild-mannered and humdrum on the surface but a superhero underneath—that’s Clark Kent and, in recent months, the Low Volatility factor. Low Vol stocks are unexciting by definition, and the factor’s current holdings focus on utilities, REITs, and insurance companies.
.jpg?fit=fillmax&w=222&bg=FFFFFF)
Factor Tilts at Mid-Year
_Page_1.jpg?fit=fillmax&w=222&bg=FFFFFF)
Factors provide investors with the ability to shift their portfolio’s characteristics to fit a particular economic and market outlook. Value might look appealing under one set of conditions while Quality might be more desirable in another. We developed a research platform that analyzes various drivers of factor returns, summarized in Exhibit 1.
Perception for the Professional
May 2026 Issue

Featured Articles
Sector Navigator
May 2026 Issue
