Chart Of The Week
What’s Ailing The Staples?
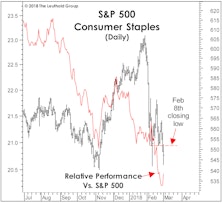
The setback that began in late January qualifies as the sixth intermediate correction of the current bull market, where “intermediate” is defined as an S&P 500 loss ranging between 7%-12%...
The Commodity Stock Disconnect
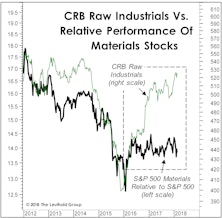
While watching a forecast go awry is painful, there’s an alternative that we consider to be even worse: the failure to be paid on an accurate forecast. The resulting feeling of helplessness must be similar to that of a corporate director who manages to lose money on inside information.
Why Is Discretionary Leading?

For at least the last year we have argued that late bull market conditions would tend to reward momentum strategies over mean-reverting ones. That’s played out not only during the market’s melt-up phase, but also (to our surprise) during the recent two-week air-pocket, at a time when we would have expected to see at least a temporary setback in the ratio above.
Active vs. Passive Return Drivers: Updated Through Year-End 2017

Our ongoing research into the relative performance of Active vs. Passive fund styles is based on the belief that just as market conditions cycle, so does the active-passive return spread..
Are Higher Rates Set To Hit The Low Vol Stocks?

The Low Volatility theme has been the darling of this bull market, benefiting from years of skepticism surrounding the economic expansion and the related lack of competition from fixed income instruments...
A Fond Remembrance Of Y2K… And Great Values
We’ve participated in this year’s upside market surge, while at the same turning a bit wistful in remembrance of a simpler and saner stock market era—an era when one could buy more than a third of the Leuthold 3000 stock universe for less than 14x earnings. Yes, that’s the comparative period of stock market sanity that existed in late February 2000, just days before the NASDAQ Composite made its historic bubble-era peak.
Late In Bull Market, But Not Terminal
.jpg?fit=fillmax&w=222&bg=FFFFFF)
The bull market continues to behave like one that’s in a late—but not terminal—phase. After a stumble late last year, the Momentum leaders have already reasserted their dominance, opening up a four percent lead on the Value stocks YTD after crushing them in 2017.
Growth: Too Much of a Good Thing?

Growth has trounced Value over the past year, continuing a decade-long trend of outperformance...
A Long-Term Take On Sentiment
Tax cuts, a strong economy, and daily stock market records have lifted measures of investor sentiment to levels not seen in two decades. But sentiment is only a slightly better timing tool than valuations (which is not saying much), and there’s plenty of room for excitement to build before a final top is at hand.
Temporary Power Outage?
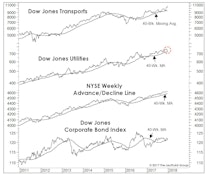
With the northern U.S. stuck in a deep-freeze, there could hardly be a worse time for the nation’s utilities to fail. But conventional chart work suggests that is exactly what’s happened. The Dow Jones Utility Average fell below its 40-week moving average last Friday, dropping the simple four-indicator model, shown in the chart, into third gear after it had spent most of the year with “four on the floor.”
Market Thoughts In The "Season Of Excess"
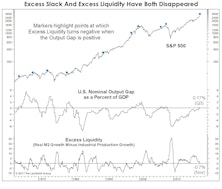
While investors look high and low for signs of excess that might portend the next bear market, they should pause and consider the excesses that have recently gone away.
Is The Market Too Strong To Top Out?

We observed in July that at an age when most bull markets are prepared to see the mortician, this one still seems to need a pediatrician. And five months later, the bull is acting as immature as ever!
Yawn? Another Sentiment Warning

The stock market has disregarded any and all caution flags throughout 2017, and the consensus is that it will continue do so through year-end.
The "Mo-Mo" Market Probably Isn't Finished

Momentum has had a terrific year relative to all other quant factors, but Wednesday’s action forewarns of the mayhem that will likely accompany the eventual rotation out of Momentum (and Growth) and into Value stocks.
It Still Doesn’t Look Like A Top

While there are certainly some performance disparities within the U.S. stock market, there’s no way we can argue (even if we’d like to) that it has become too selective.
The Seasonality Of Earnings Season

Years ago, Monty Python’s classic comedy sketch introduced us to the Department of Redundancy Department.
Tax Reform Or Not, The Budget Is Already Busted

In 2010 and 2011, we were sometimes chastised for not paying more attention to exploding federal deficits, which at the time were running between 8% to 10% of GDP. We argued that a substantial share of these budget shortfalls was cyclical in nature, and would eventually be reversed by an improving economy.
Time To Embrace "Equality"?

While this year’s rally has been a broad, “equal opportunity” affair, some of the weakest relative action we’ve observed has—oddly enough—been among equal-weighted stock market indexes. Equal-weighted indexes for Large, Mid, and Small Caps are all trailing their cap-weighted counterparts year-to-date, and the gap for the S&P 500 is now almost 400 basis points after an especially bad October.
Two Sector Picks For The Home Stretch

With the Major Trend Index positive and the market about to enter the seasonally most bullish part of the calendar, we’ll offer both a trendy sector and a contrarian one for allocators looking to cap off an already good year. Specifically, we’d recommend heavy exposure to both the Information Technology and Financial sectors, which rate #3 and #1 in the October Group Selection (GS) framework.
The Smart Money Sleeps In
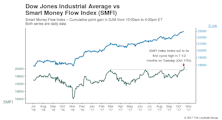
From a purely technical perspective, the bull market has hardly been lacking for feathers in its cap. Yet it earned another one on Tuesday when the DJIA Smart Money Flow Index (SMFI) broke out to a new bull market high (Chart 1), erasing a “non-confirmation” that had stood since March 1st. This index thereby joins the broad list of market bellwethers—chronicled in the last Green Book—that have participated in the parade of new highs.
Perception for the Professional
May 2026 Issue

Featured Articles
Sector Navigator
May 2026 Issue
