Momentum
Revisiting Value & Momentum: Sign Of A Top?

Relationship of Momentum stocks and Value stocks has historically demonstrated that at market tops, Momentum does best while Value lags. That pattern is occurring now, but based on prior history the top would not come until Q1 2011.
Factor Performance Shows Flight To Quality
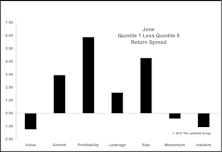
Momentum cannot sustain itself, as multiple trends reversed over last two months. Profitability focus has returned to the marketplace as risk aversion grows.
The Value Of Value Investing: A Global Perspective

As one of the oldest investment philosophies, value investing has certainly stood the test of time. The recent market meltdown is no exception.
The State of Momentum Investing: A Global Perspective

Most quantitative portfolio managers employ some variation of the momentum strategy, and most have had a hard time with this particular strategy since the end of 2007.
Positive Technical Trends
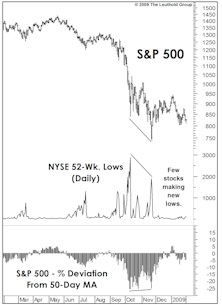
While there is plenty to worry about, some important technical trends still suggest that November 20, 2008 stands a good chance of being the final low of this bear market.
Struck Down By The "Killer Wave"
Last January we noted the appearance of a rare and dangerous technical configuration in the Dow Jones Industrials Average. Some analysts have described this topping pattern as the “Killer Wave”, and did it ever live up to that nickname in 2008.
Technical Comment: Momentum “Divergences” Are Now In Place
The November leg down in stocks was brutal. However, from a technical perspective, the decline was accompanied by the kind of “positive divergences” that typically appear at major lows.
Materials: From First To Worst
Materials sector has fallen fast and hard in our GS Score rankings and is now the worst rated. Still see further downside based on valuations and technical factors. No, we do not think the underlying commodities can outperform while the stocks fall.
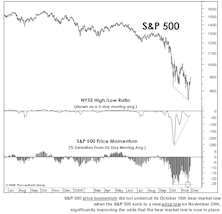
A New "Internal" Low In Stocks: Implications

Price momentum now indicating there may still be one more leg down in this bear market. Typically, price lows come after momentum lows, and a new momentum low was hit in mid-July. Similar analysis of NYSE New Highs/New Lows data supports this conclusion.
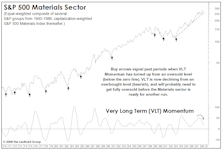
Client Question: VLT Buy Signals

“Given the broad declines in the stock market since October 2007, are there any particular industry groups which are beginning to look washed out enough to trigger a buy signal on the VLT work you employ in your Group Selection Scores?”
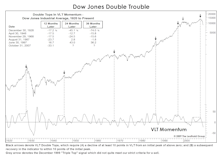
Dow Double Trouble
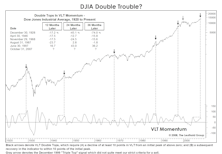
Our VLT (Very Long Term) Momentum algorithm—alternatively known as the Coppock Curve or “Madness of Crowds”—has just rolled over after forming a rare “double top” formation. Why has the rare VLT Double Top typically proven lethal for the stock market?
VLT Momentum On U.S. Currency...Applications (And Implications) For The Weak Dollar

Quite simply, VLT (which stands for Very Long Term) is a momentum oscillator which works best as a buy signal. Some market technicians have also suggested that VLT Momentum back-tests well as a currency indicator.
Momentum/Breadth/Divergence Category Moves To Negative Ground
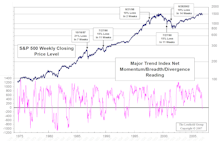
With this category now breaking into negative territory, we thought it would be interesting to look back at the other periods when the Momentum/Breadth/Divergence category shifted from a positive net reading to negative.
Earnings Momentum Excluding Energy: Energy’s Boost To Become A Drag?

Energy sector earnings growth has helped keep overall S&P earnings advancing at a relatively strong rate. Growth would be about 9% to 10% below reported growth if Energy stocks were excluded.
Small Cap Leadership…..7th Inning, But Game Could Be Rained Out At Any Moment

Our equity exposure still overweight in small and mid cap stocks, but we expect the market is progressing to a state of parity.
The VLT Momentum Indicators…..Third Buy Is A Charm

VLT Momentum registers another buy signal. Only in the 1930s has a similar pattern of buy signals developed. Third buy led to big gains back then.
Better Top Line Growth Points Toward Improved Bottom Line

Earnings momentum may appear to be slowing, but it is last year’s comparisons that were overstating the results.
And Now...Back To The Fundamentals

No doubt, “relief” was the primary component in April’s performance formula. Wall Street can now redirect the focus back to issues of domestic consequence….things like earnings, valuations, and economic growth.
The VLT Momentum Indicators…..New Buy Signals On S&P 500 & DJIA

VLT Momentum, a long term technical measure, recorded buy signals on S&P 500 and DJIA. This is a very reliable indicator.
De-Mystifying VLT Momentum

An explanation of VLT Momentum (The Coppock Curve); what it is and how we use it.
Perception for the Professional
March 2026 Issue

Featured Articles
Sector Navigator
March 2026 Issue
