Momentum
Acting Like A “New” Bull Market?

With DJIA and S&P 500 losses in the 2015-16 decline limited to less than –15%, there’s no way we’d argue the episode represented a completed cyclical bear market (and we said so at the time).
Not Much “Lift” From VLT “BUY”
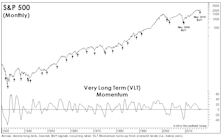
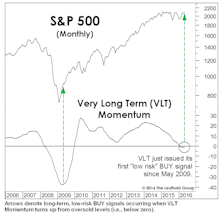
In the June Green Book, we professed some skepticism surrounding the long-term, “low-risk” BUY signal for stocks that was triggered at the end of May by our Very Long Term (VLT) Momentum algorithm (also known as the Coppock Curve).
More Upside For Small Caps?

There was a major cyclical BUY signal (VLT Momentum) for the S&P 500 in late-May, and as of July’s close, that bullish development was reinforced by a new VLT BUY signal on the Russell 2000.
VLT Says “BUY”
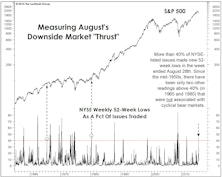
Breadth underlying the 4-month upswing has been stronger than that observed during any other rally leg since 2013. Despite just a 14% correction in the S&P 500 from its peak, a new VLT “BUY” signal was triggered. Failed signals are relatively rare, the last one occurred in December 2001.
MTI Now Bullish, But Doubts Linger

The Major Trend Index reverted to its bullish zone in the week ended April 15th, following almost ten months in which the work resided in either neutral or negative territory.
A Turn In Leadership?
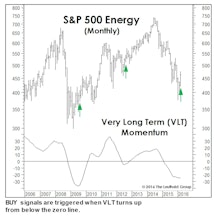
Last month we wrote that a big March gain would trigger a Very Long Term (VLT) Momentum BUY signal on the S&P 500 (Chart). The month’s 6.8% S&P 500 gain wasn’t quite enough to do the trick, but we’re intrigued that VLT did issue BUY signals for three of the market’s cyclical sectors, including Energy, Materials, and Industrials.
Earnings Momentum

The final month of 2015 earnings reports registered an Up/Down Ratio of 1.07. Once again, we have to go back to the dark days of 2009 to find a lower “three-month” ratio.
Factor Performance Reverses

With the exception of Value, March was a bad month for quantitative factor performance. Every other factor category we follow underperformed, with Momentum posting its second consecutive –5% spread.
Implications Of Oversold VLT Momentum

The S&P 500 decline has yet to come close to a bear threshold, but it’s nonetheless been sufficient to drive the Very Long Term (VLT) Momentum algorithm into oversold territory for the first time since late 2009. In 16 of 21 prior cases, VLT Momentum’s initial oversold reading was a harbinger of a market that was soon to become even more oversold.
Earnings Momentum

The second month of Q4 2015 earnings reports registered an Up/Down Ratio of 1.12—up from the post- financial crisis low of 1.11 last quarter. With 51% of the observations in February, the “Up” count edged out the “Down,” but barely.
Momentum Trouble

Momentum reversed in February, primarily due to rallying Materials stocks. Value and Profitability both performed well.
Learning From Failures?
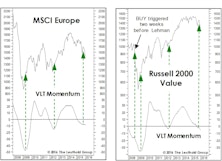
There’s an old trader’s adage which holds that “the most powerful sell signal is a failed buy signal.” Last fall we noted that European equities and Small Cap Value had triggered BUY signals on our Very Long Term (VLT) Momentum algorithm.
Asset Allocation: Buy Weakness Or Strength?
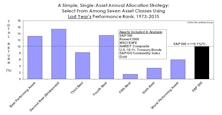
Models can prove helpful in overriding an investor’s natural (and frequently costly) impulses. But we’ve come to believe that our long experience in model building and implementation has succeeded not only in overriding these impulses but in actually modifying them.
Bridesmaid Asset Strategy
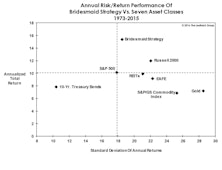
Liquidity “consuming” strategies like price momentum are generally considered to be more volatile than liquidity “providing” approaches like value investing.
Stick With What’s Working (Until It’s Not)

The year has been especially tough on managers who might have shared our cyclical worries over the stock market, but who’ve elected to stay fully invested via seemingly lower risk value approaches.
BUY Signals In A Topping Market?

Here’s an example of just how disparate underlying market action has become: with the S&P 500 only 2% away from a cycle high, several major U.S. and foreign market indexes have already moved into an oversold position on the basis of our Very Long Term (VLT) algorithm—with a few (including EAFE, Chart 1) actually triggering “long-term, low-risk” BUY signals in the last two months! We are not sure what to make of this action.
Quantitative Factor Performance: What Is Working?

For the third consecutive year (thus far), quantitative factors worked best within the Materials sector. Energy also saw success as the decline in oil hurt the same stocks as in 2014. Factors were least effective in Health Care and Telecom.
VLT Flashes A BUY On Oil
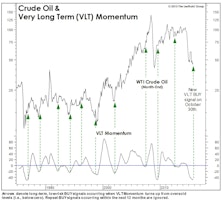
As expected, our VLT Momentum algorithm triggered a “low-risk” cyclical buy signal on crude oil in late October, only the 11th buy signal in the past 30 years. This algorithm was originally designed to identify low-risk entry points into the stock market, but we’ve found it useful with other assets as well.
"Oversold" Doesn't Mean BUY
A Lasting Low In Crude?

In our naïve way of measuring market moves, WTI crude oil is about 15% from its $53.27 December 31st closing price. But thanks to financial television, we’re beginning to wise up.
Perception for the Professional
March 2026 Issue

Featured Articles
Sector Navigator
March 2026 Issue
