Major Trend Index
MTI Weakened; Ratio Still Bullish

The Major Trend Index fell 0.07 to a ratio of 1.14 based on data for the week ended June 17th, reflecting another sizable weekly decline in the Attitudinal category.
MTI Down 0.03 Points To A Ratio Of 1.21

The Major Trend Index edged down 0.03 points to a ratio of 1.21 based on data for the week ended June 10th, triggered mainly by an 80-point drop in the Attitudinal category.
Rally Extension?
We’ve boosted equity exposure twice in the past several weeks, fully cognizant that it’s not a “textbook” time to do so.
MTI Moves Further Into Bull Territory

We’re fully cognizant that it’s not a “textbook” time to raise exposure, however, outside of valuations, the balance of our MTI work suggests the market still holds some cyclical appeal.
MTI Positive; Few Changes Among Category Readings
The Major Trend Index remained in moderately bullish territory, falling 0.03 points based on data through last week. A 75-point loss in the Momentum/Breadth/Divergence work was the only outsized move among the five indicator groupings. This category, however, remains the strongest pillar underlying the MTI with a current net reading of +440.
Valuations: The Correction That Never Was
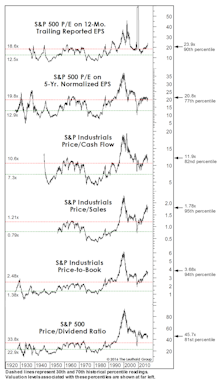
The correction failed to meaningfully “reset” any long-term valuation measures, hence, we don’t view the current environment as having much investment merit, but rather, primarily speculative appeal.
“Four On The Floor”
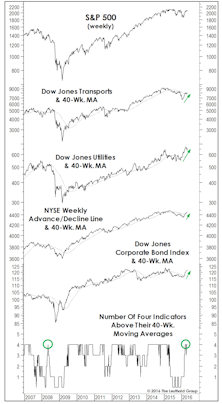
Leadership, breadth, and corporate credit all staged intermediate-term breakouts, rising above their respective 40-week moving averages. In this formation, historically, S&P 500 annualized return is +15%.
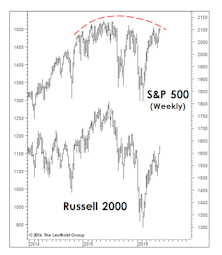
Sizing Up The Rally
While our MTI became bullish in mid-April, we can’t rule out that the rebound from February lows could be an impressive bear market rally. However, this rally sports impressive technical credentials.
MTI Now Bullish, But Doubts Linger

The Major Trend Index reverted to its bullish zone in the week ended April 15th, following almost ten months in which the work resided in either neutral or negative territory.
Major Trend Moved Into Moderately Bullish Zone

Riding a major upswing in the Momentum/Breadth/Divergence category, the MTI moved to positive for the first time in almost 10-months. Tactical Funds’ net equity exposure increased to near 55%.
MTI Holds Positive; Momentum Measures Strong

Based on data through the week ended April 22nd, on the back of a 100-point gain in the Momentum/Breadth/Divergence category, the Major Trend Index pushed a bit further into positive territory, rising 0.03 points to a 1.13 ratio. Leuthold tactical portfolios remain positioned with net equity exposure of 54%.
MTI Returned To Positive Zone

The Major Trend Index returned to bullish ground based on data through the week ended April 15th, rising 0.07 to a ratio of 1.10. While it’s a struggle to put together a compelling fundamental (and especially value-based) argument for U.S. equities here, we can’t ignore the improvement in the MTI and related models used for reinforcement. But prices move ahead of fundamentals, and perhaps the work is discounting better times in the months ahead (rebounding earnings?).
MTI Remains On High End Of Neutral Zone

The Major Trend Index fell 0.01 to a ratio of 1.03 based on data ending April 8th, with moderate gains in the fundamental inputs (Valuation, Economics) offset by losses in components related to market action and investor psychology.
Improving Indicator Evidence
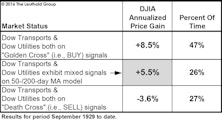
Last spring’s “Double Death Cross” in the Dow Transports and Dow Utilities had been partially reversed even before the February low, when the Dow Utilities’ 50-day moving average crossed above its 200-day moving average (thereby issuing a “Golden Cross”). The Dow Transports remain in a bear pattern based on the 50/200-day relationship, but the gap is closing fast.
Stock Market Observations
The stock market rally off the February 11th lows has been powerful enough to lift the Major Trend Index into its Neutral zone (in fact, a high-neutral ratio of 1.04), and therefore certainly deserves some level of respect.
Has The Hook Been Set?

Two months ago, we suggested a short-term bounce in oil might prove to be the fundamental “hook” that would rationalize a bear market rally. We thought a bounce to $45 might do the trick—and oil futures essentially cooperated, reaching $41.90 on March 22nd.
MTI Moved Up To High End Of Neutral

The Major Trend Index rose 0.04 to a ratio of 1.01 based on data through last week, reflecting moderate gains in the Economic and Technical work. Net equity exposure in the Leuthold Core and Global Funds remains at 40% after last week’s small equity hedge increase of 6%.
MTI Flat; Equity Hedge Increased As Market Rallied

Based on data through the week ended March 18th, the Major Trend Index was unchanged with a 0.97 ratio (low-neutral zone). A big gain in the Momentum/Breadth/Divergence grouping was entirely offset by relatively sizable losses in the other four categories. These category movements prompted us to cut Leuthold Core and Global Funds’ net equity exposure to 40% (down from 46%). Short-term, an MTI return to negative territory could trigger additional increases to the equity hedge.
Strong Bear Rally Pushes MTI Into Lower Neutral Zone

Based on data through the week ended March 11th, the Major Trend Index improved 0.07 points to a marginally “Neutral” reading of 0.97 (readings of 0.95—1.05 are Neutral zone). A near 200-point gain in the Momentum/Breadth/Divergence category was the sole driver, offsetting moderate losses in the remaining four categories.
MTI Negative; Market Rally Remains Intact
The Major Trend Index ticked down 0.01 point to a ratio of 0.86 using data for the week ended February 26th. Losses in our sentiment and valuation work offset the technical improvement that had stemmed from recent market gains. The economic category stabilized following a multi-week slide, although there’s no sign the current earnings recession has begun to abate.
Perception for the Professional
March 2026 Issue

Featured Articles
Sector Navigator
March 2026 Issue
