Major Trend Index
MTI: Little Change Week Over Week

Read this week's Major Trend Index.
MTI: Momentum Work Deteriorates Modestly

Read this week's Major Trend Index.
MTI Steady Throughout February

The Major Trend Index has remained in a tight, bullish band of 1.12-1.18 throughout the market’s post-election push to new highs. We are holding equity exposure in the Leuthold Core and Global Funds at 65-66%, the high end of their 30-70% boundaries.
A “Good Year” To Start The Year
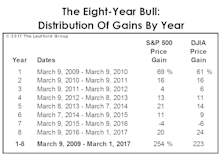
The S&P 500 was up 6.4% YTD through March 3rd, a bit above its average annualized gain of 5.9% since 1926. In other words, 2017 would be a good year if the books were closed today.
MTI: Market In The Midst Of Late-Cycle "Melt-Up"

Read this week's Major Trend Index.
MTI: Strongest Reading Since Mid-November

Read this week's Major Trend Index.
MTI: Market Breadth Measures Confirm New Highs

Read this week's Major Trend Index.
MTI Extends Bullish Streak

The Major Trend Index stabilized in a moderately bullish range during the past several weeks.
MTI Supports Fairly Aggressive Stance

Read this week's Major Trend Index.
MTI Unchanged, Suggests Hospitable Environment

Read this week’s Major Trend Index.
MTI: Remains Bullish - Momentum Work Is Strong

Read this week’s Major Trend Index.

MTI: No Significant Swings Among Factor Categories

The Major Trend Index rose 0.02 points to a ratio of 1.14 for the week ended December 23th, with no significant swings within the five factor categories. While the Intrinsic Value work reached another new extreme for the bull market, the balance of the MTI suggests that the category is likely to erode even further before this old bull finally gives up the ghost. Our tactical funds remain positioned with net equity exposure of 64%.
Technical Work Pulls MTI Lower

The Major Trend Index fell 0.05 points to ratio of 1.12 for the week ended December 16th, with a moderate loss in the Momentum/Breadth/Divergence category responsible for most of the decline. Net equity exposure in our tactical portfolios is unchanged at 63-64%.
MTI: Market Breadth Is Strong

The Major Trend Index increased 0.05 points to ratio of 1.17 for the week ended December 9th, led by the largest one-week gain in the Momentum/Breadth/Divergence category since mid-July. Some developments contributing to that gain were detailed in last Friday’s “Chart of the Week,” and suggest that a final bull market high is unlikely to be made during the next three to six months. Our tactical portfolios remain positioned with net equity exposure of 63-64%.
MTI Drops Sharply

The latest Major Trend Index report.
New Breadth Highs For S&P Broad Indexes
Click to read the latest Major Trend Index report.
MTI Positive; Market Indexes Hit New Bull Market Highs

The Major Trend Index dropped 0.04 to a ratio of 1.16 based on data for the week ended November 18th. It was pulled lower by small to moderate losses within each of its five indicator categories. Despite the MTI’s decline from the high levels that persisted throughout much of the fall, this “weight of the evidence” approach remains bullish for the stock market. Our tactical funds continue to target net equity exposure of 63-64%.
MTI Positive, Technicals Still Strong

The Major Trend Index fell 0.02 to a ratio of 1.27 for the week ended October 28, 2016. Movements within the indicator categories continued the trend of recent weeks, in which losses in the Momentum/Breadth/Divergence work have been almost entirely offset by gains elsewhere.
MTI Declined 0.01 Points To 1.29
The Major Trend Index declined 0.01 points to a ratio of 1.29 in the week ended October 21st, marking the 12th consecutive week the Index has been above the 1.20 level.
Perception for the Professional
March 2026 Issue

Featured Articles
Sector Navigator
March 2026 Issue
