Bear Market
Another Stab At The “Downside”
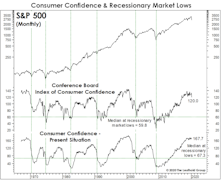
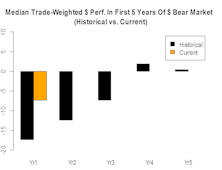
How far might the S&P 500 fall in a recessionary bear market? The 2002 and 2020 stock market lows were both produced by “recessionary” bears; based on history back to the 1920s, those two lows stand out as the priciest bear market bottoms on record—and it’s not even close.
“Toro Nuevo” Or Mirage?
While our breadth measures do not consider this rally to be thrust-worthy, when based on nothing more than performance, it’s difficult to distinguish between the “first up-leg” in a new bull market and a bear-market rally. The vital signs at present appear to be more in-line with the latter (although making that conclusion based on price action, alone, is hardly better than a coin toss).
The Active/Passive Performance Cycle Second Quarter 2022 Update
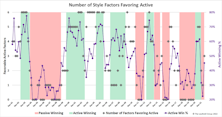
The performance derby between actively-managed portfolios and passively-managed index funds is a topic of ongoing interest for Leuthold clients and the investment community at large. Therefore, we are providing an update to all charts and tables of our Active/Passive performance analyses.
Not Dot-Com
Bulls have been quick to assure us that this market “bears” no resemblance to the dot-com bust. We agree—but probably for very different reasons. Among them are the conventional breadth measures, which provided little warning of this year’s January peak. And, the initial decline off January’s top has been much broader than during the first phase of the dot-com bust.
Two Ways To Spin The Russell 2000 “Bear Market”
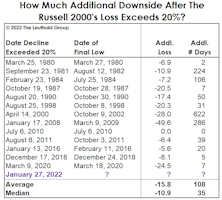
At the market’s January 27th close, the headline blared, “Russell 2000 Enters Bear Market.” Well, not exactly. If one accepts that a 20% decline constitutes a bear market, then the bear actually began on November 9, 2021—the day after the Russell 2000 peak.
How Much Inflation Is Too Much? It’s A Moving Target
.jpg?fit=fillmax&w=222&bg=FFFFFF)
In the latest Green Book, we noted that Producer Price Inflation does not usually become a challenge for the stock market until its annual rate breaks above 4.0%. The day that comment was published, the year-over-year gain in the March PPI for Finished Goods spiked to 6.0%, thanks mostly to the well-celebrated COVID-19 anniversary-effect.
A Bear Market In Price, But Not Time
We have a hard time accepting that the excesses associated with an eleven-year bull market and expansion can be fully expunged in 27 trading days, no matter how ugly those days were… keep some powder dry!
Leadership Rotation And Bear Markets
Bear markets are the financial system’s version of the changing seasons—a cycle we “enjoy” to extremes here in Minnesota.
Sentiment Has Been Crushed, But Might Need To Just Languish For A While
.jpg?fit=fillmax&w=222&bg=FFFFFF)
We didn’t see the coronavirus coming and, like millions or perhaps billions of others, underestimated its likely economic impact when it began to spread. But stock market risks were high well before the virus hit.
How Sharp Is This Falling Knife?
.jpg?fit=fillmax&w=222&bg=FFFFFF)
While it’s possible that Monday’s S&P 500 low of 2,386 will represent an important trading low, we believe it is too early to expect the market to form a major bear market low.
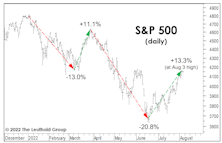
How This ‘Borderline’ Bear Stacks Up
The S&P 500 has again shown its mysterious ability to defy the conventional bear market threshold, with the decline into its Christmas Eve low becoming the fourth one in the last 30 years to halt just shy of the magic -20% figure.
It’s Not A Pause… It’s “Paws”
A bear market will almost always prove to be the catalyst of one or more shifts in long-term market leadership.
Anatomy Of A Dollar Bear Market
With the dollar index breaking below the 2017 low, we believe the dollar bull market that started in 2011 (based on the trade-weighted dollar index) is most likely over.
There’s Always A Hook...
Bear markets need a “hook”—some sort of misdirection that keeps the majority hoping. Our work suggests a primary bear market is underway, and we fear oil is this bear’s hook…but the problems run deeper than oil.
Was That All There Was To It?
As quantitative investors, the disciplines of the numbers trump stories—even our own. But we’re struck that the stories depicted by our Major Trend Index and other market tools over the past two years are entirely logical and sequential. Unfortunately these stories rhyme with those of past market cycles.
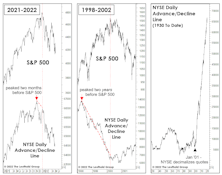
NYSE “New Lows” Figures Point To “Lower Lows”…
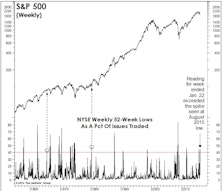
At the August and late January S&P 500 lows, both the Daily and Weekly NYSE New Lows figures exceeded 40% of Issues Traded —a degree of downside thrust rarely seen outside of bear markets.
Learning From Failures?
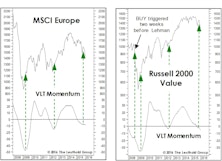
There’s an old trader’s adage which holds that “the most powerful sell signal is a failed buy signal.” Last fall we noted that European equities and Small Cap Value had triggered BUY signals on our Very Long Term (VLT) Momentum algorithm.
The “Star” Is Aligned For 2016
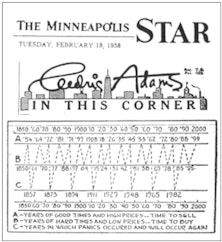
Valuations are high. Market internals are weak. And the MTI is negative. But for those seeking some truly authoritative evidence that there’s stock market danger ahead, consider the accompanying cycle chart unearthed from a gossip column in a 1958 issue of the Minneapolis Star.
A Bear Till Proven Otherwise
Major Trend Index remains decisively negative at 0.72. The “market action” category is the primary culprit behind this bearish tally, but we’ve also seen the Economic category deteriorate in recent months and would expect this trend to continue. This sequence is typical: Market action leads economic trends (and, we would argue, is a major cause of those trends).
The Bear Case: "Before And After"
Perception for the Professional
March 2026 Issue

Featured Articles
Sector Navigator
March 2026 Issue
