Articles by Chun Wang Director of Multi-Asset Strategies
Time Cycle Composite Mid-Year Update—More Volatility & Lower Returns in H2

For the first half of the year, QE tapering disrupted the usual patterns for most interest rate related markets but equities are largely on track. In the second half, the common message seems to be higher volatility and lower returns.
10-Year: 185-245 Range Broken & Higher Volatility
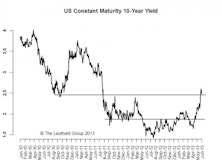
We think 3% is the upper bound in the short term. However, we believe it will settle back closer to 250 bps by the end of the year.
Long U.S. Treasuries: Big Move In May, Downside Still Significant
20 Year T-Bond: 5 3/8’s, Maturity: 2/15/2031, YTM 2.88% (vs. April 30th YTM at 2.39%)
U.S. High Yield Corporate Bonds: Maintain Neutral
High yield bonds are not immune to the tapering of QE.
U.S. Municipal Bonds: Maintain Neutral
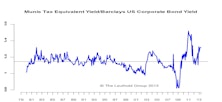
Inflows into Muni bond funds turned negative; higher interest rates currently the biggest risk.
U.S. Investment Grade Corporate Bonds: Maintain Favorable

Consistent with our overall cautious view on credits, we still like “safe spreads”.
RAI Rose Again And Stays On “Higher Risk” Signal—Remain Cautious

The RAI rose in May and stays on a “High Risk” signal. We remain cautious and recommend higher quality within fixed income.
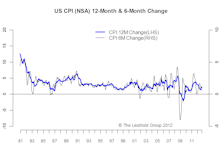
Inflation Slides Again
April inflation numbers were generally lower than expected. We are shifting out our inflation outlook by six months. We believe inflation will be a non-factor for the next six months but will increase moderately in the following six months.
Global Yield Curve Confirms “Muddle Through” View
The global yield curve is in a sideways range bound pattern, indicating anemic demand for credit. An examination of developed and emerging countries confirms our “muddle through” view.
10-Year Still Range Bound Between 185-245 But Expect Higher Volatility
We think the 10-year yield will likely consolidate around 200-215 before taking a shot at 245. The 245 level looks like a strong barrier and will likely hold in the foreseeable future.
Weaker Currency = Higher Net Exports? It’s A Myth

In the medium term (1-2 years), weaker currency actually leads to lower net exports because export prices go up, instead of down, when currency depreciates.
"Muddle Through"

The global economy is stuck in a “muddle through” mode with developed and emerging countries showing divergence in terms of leading indicators. Despite this divergence, they share one thing in common: an upturn in inflation. How much more room there is for easing is a key determinant of asset market performance.
Implications Of The End Of Negative Real Yield
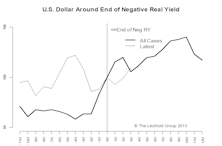
The 10-year real yield turned positive at the end of 2012 and has stayed there. We expect higher interest rates, a stronger dollar, and lower gold prices in the next twelve months.
The Weakening Yen — Too Far Too Fast

We are highly skeptical “Abenomics” can produce different results this time.
Inflation Slightly Lower Than Expected
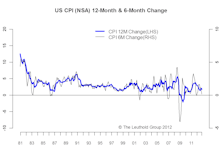
The non-seasonally adjusted CPI fell 0.5% from October to November, lower than expected.
The Upside Breakout

We still think interest rates are likely to be range-bound, but the range will likely shift higher to the 185-240 bps area if the current breakout is successful.
New “Higher Risk” Signal — But We Remain Cautiously Optimistic

We’re downplaying the new signal’s significance and remain cautiously optimistic towards risky assets near term. Our biggest concern is that a rise is extremely likely going forward.
No Big Change — Inflation Remains Moderate
The non-seasonally adjusted CPI was essentially flat in October, in line with market expectations.
The State Of Interest Rates

We think interest rates will stay low for an extended period of time, so the key question is, when will rates start rising?
Value Vs. Momentum Performance

We see a strong and clear Poor-Value/Strong-Momentum pattern emerging, which could indicate a looming market top. While QE3 could disrupt it, the pattern looks unmistakable.
Perception for the Professional
March 2026 Issue

Featured Articles
Sector Navigator
March 2026 Issue
