Stock Market Internals Earnings Momentum, Small/Mid/Large Caps, Growth/Value/Cyclicals, and Additional Factors
Earnings Momentum

Our Up/Down ratio kicked off Q4 earnings season with a 1.57 reading. This “one-month” ratio is by far the highest of 2022, thus far. As usual, January reporting was very light, so don’t read too much into the numbers.
Small Cap vs. Mid Cap vs. Large Cap

In January, the Russell 2000 had its best month relative to the S&P 500 since last February. Another Small Cap head-fake? Or maybe the start of a fresh run, like September 2020-February 2021? (i.e., Russell 2000 +46%, S&P 500 +13%.)
Growth vs. Value vs. Cyclicals
Both Growth and Value Small-Cap style boxes gained 10% in January’s rally. However, SC Growth remains well in the rearview mirror since its relative strength peak in September 2020: Small Cap Growth +8% versus Small Cap Value +60%.
Additional Factors
The S&P 500 had an almost biblical upheaval to start 2023. The “last were first” and the “first were last.” In January, the 100 worst performing stocks of 2022 had an average return of +16.1% while last year’s 100 best performers posted +1.7%.
Looking For A Bright Spot

Our Up/Down ratio ends the Q3-22 earnings season with a pitiful reading of 1.07—very near the previous two quarter’s “final readings.” This vignette hasn’t had much longer stretches at such low levels (outside the Financial Crisis). Perhaps a sign we’re in the latter innings of an EPS downturn?
Small Cap vs. Mid Cap vs. Large Cap
Our Ratio of Ratios ends 2022 at a two-and-a-half-year low. Like 2019, 2020, 2021, and 2022, Small Caps seem primed for outperformance in 2023. Some kind of economic turmoil (perhaps underway) is probably needed to jolt them back into favor.
Growth vs. Value vs. Cyclicals

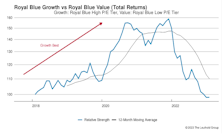
At the end of November 2022, Royal Blue Value saw its largest twelve-month-rolling return gap (43%) over Royal Blue Growth since 2001.
Additional Factors

We wrap up 2022 with the S&P 500’s only positive performance quarter for the year—ending the longest quarterly losing streak (three quarters) since the Financial Crisis (six quarters). The year also drew some comparisons to the deflation of the Tech Bubble, as S&P 500 Value (-5%) demolished S&P 500 Growth (-29%) by the widest margin since Y2K.
Earnings Momentum

After a decent start with the Q3 “one-month” reading, the ratio is back down in familiar territory; every quarter this year has now registered a “two-month” reading between 1.04 and 1.08. Values in that range have always been associated with a recession.
Small Cap vs. Mid Cap vs. Large Cap

After a month of Small Cap underperformance versus Large Caps, our Ratio of Ratios has crashed through contemporary lows. On a relative basis, only the three months that followed the onset of the pandemic registered deeper discounts for Small Caps.
Growth vs. Value vs. Cyclicals

In the last year, Royal Blue Value (+17%) has dominated Royal Blue Growth (-26%). That is almost a mirror image of the nine-month run for Growth between November 2019–September 2020: Royal Blue Growth +30%; Royal Blue Value -9%.
Additional Factors

The S&P 500 ended November 14% higher than its contemporary low seven weeks earlier. Last month contained two of the three best trading days (+5.5% and +3.1%) since April 2020, as a mild consumer inflation reading and dovish Fed Chair comments buttressed hopes for a policy pivot.
Eye on Earnings

With the first month of Q3-22 earnings in the books, our Up/Down ratio is 1.42, which is markedly better than the first two quarters (1.09 each). However, given falling estimates, the latest uptick probably isn’t the start of something bigger.
Small Cap vs Mid Cap vs Large Cap

Our Ratio of Ratios had a slight rebound from September’s contemporary lows. The October bounce was more pronounced in Small Caps, as that flavor of equities had its best monthly performance, relative to Large Caps, since February.
Growth vs Value vs Cyclicals

Our best-performing style box in October, Royal Blue Value (+14.2%), clawed its way into positive territory (+0.8%). All five of the other style boxes are trailing RB Value by 12-32% YTD.
Additional Factors

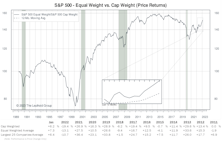
Value stocks have had incredible performance relative to Growth. At the end of October, IVE (iShares S&P 500 Value) had a 20% YTD advantage over IVW (iShares S&P 500 Growth). That’s easily the largest annual performance gap in favor of Value: Over the 22-year history of data, no other year reached double digits.
Earnings Momentum

With the final month of Q2-22 earnings complete, our Up/Down ratio reads 1.02. That is very close to the 1.05 ratio for Q1. Both readings fall below the vignette’s recession threshold of 1.07 (in the past 39 years, all readings below that mark were accompanied by an “official” economic recession).
Small Cap vs. Mid Cap vs. Large Cap

This is the lowest relative valuation registered for Small Caps since May 2020. The end of September also marked the lowest absolute trailing valuations for both Large Caps (20.7x) and Small Caps (15.0x) in our L3000 universe looking back to April 2020.
Growth vs. Value vs. Cyclicals

More pain for our Royal Blue Growth segment (Large Growth proxy). Q3 performance (-6.9%) was the worst for our style boxes and contrasted against the other Growth boxes (SC Growth +0.2%, MC Growth -0.6%).
Additional Factors

The S&P 500 pegged its third consecutive quarterly loss, a remarkable feat for the Index. It hadn’t produced back-to-back quarterly losses (total return) since the Great Financial Crisis. Investors opening their quarterly statements in the next week or so, accustomed to a sharp reversal of losses like those in 2011, 2015, 2019, and 2020 may be in for a surprise.
Perception for the Professional
May 2026 Issue

Featured Articles
Sector Navigator
May 2026 Issue
