Stock Market Internals Earnings Momentum, Small/Mid/Large Caps, Growth/Value/Cyclicals, and Additional Factors
Earnings Momentum

Up/Down Earnings: Q4 Results Just Below Historical Average. Median Q4 YOY Revenue Comparisons: Strength In Large Caps. Q4 Median Company Earnings Growth: Initial Results Are Impressive
S&P 500: Equal Weighted Index Better in 2013
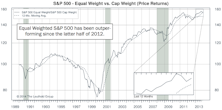
For 2013, the Equal Weighted Index bested the Cap Weighted Index by 4%. The Equal Weighted Index has outperformed the Cap Weighted Index in four of the past five years.
Growth/Value/Cyclicals

Growth Stocks Best In All Three Cap Categories.
Small/Mid/Large Caps
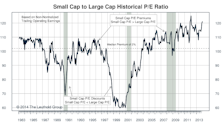
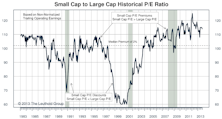
Small Cap Premium Continues Upward To 21%. The red-hot equity market of 2013 was especially good for Small Caps with a +38.8% total return.
Earnings Momentum

Up/Down Earnings: Q3 Ends Below Average. Median Q3 YOY Revenue Comparisons: Small And Mid Caps Continue Leading. Q3 Median Company Earnings Growth: Mid Caps Continue Leading
Dissecting The Capital Tier Indices

Sector weight changes during November were minimal.
S&P 500: Cap Weighted Outperforms For The Second Month In A Row
During November the Cap Weighted S&P 500 (+2.8%) outperformed the S&P 500 Equal Weighted (+2.1%) for a second consecutive month.
Growth/Value/Cyclicals Market Internals

Growth Stocks Lead YTD In All Three Cap Categories.
Small/Mid/Large Cap Internals
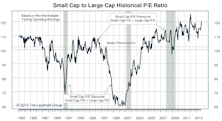
Small Caps are selling at a 20% valuation premium relative to Large Caps, using non-normalized trailing operating earnings.
Earning Momentum
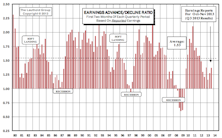
While the current ratio of 1.37 is relatively weak historically, it is still an improvement from the second months’ readings of Q2 (1.27) and Q1 (1.16).
Up/Down Earnings: Q3 First Month Results Close To Historical Average

The first month of Q3 earnings came in with an Up/Down reading of 1.73, just below the historical average of 1.81 but ahead of the first months’ readings for Q2 (1.59) and Q1 (1.38).
Small Cap Premium Ticks Up To 16%
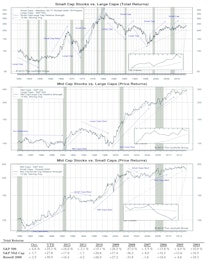
Small Caps are selling at a 16% valuation premium relative to Large Caps, using non-normalized trailing operating earnings. Using estimated operating earnings, Small Caps are selling at a higher valuation premium of 23% (25% last month).
Large Cap Growth Bounces Back The Past Two Months

Growth stocks are now all above their historical average valuation levels. Value stocks are all solidly overvalued compared to their recorded averages.
S&P 500: Cap Weighted Outperforms During October
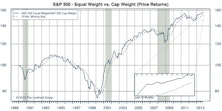
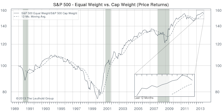
The Cap Weighted S&P 500 (+4.5%) slightly outperformed the S&P 500 Equal Weighted (+4.2%) during October. YTD, the spread between these two indices remains wide, with the Equal Weighted index outperforming by 4.2%.
S&P 500: Equal Weighted Outperforms In Q3; Maintains Lead YTD
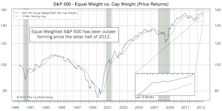
On a YTD basis, the spread between these two indices continues to expand, with the Equal Weighted index now outperforming by more than 4%. Consumer Staples is the most expensive sector among Large and Mid Caps, while Health Care is most expensive in Small Caps.
Growth Continues Leading In Mid And Small Caps YTD, Large Cap Growth Bounces Back

All three cap tiers of Growth also now ahead for the YTD. Growth stocks are moving towards their his- torical average valuation levels, with Mid Cap Growth now being overvalued. All Value stock segments continue to be solidly overvalued.
Earnings Momentum - Q2 Reports Below Average But Ahead Of Q1

With all three months of Q2 earnings reports in, the 1.28 ratio is much stronger than Q1, but remains below the 1.51 historical average ratio.
Up/Down Earnings Ratio: Q2 Reports Below Average But Ahead Of Q1
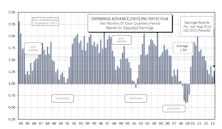
With two months of Q2 earnings reports in, results have continued trending downward with a reading of 1.27.
Q2 Median Revenue Comparisons: Higher Growth Across All Segments
Large Cap result this month is the same as last month, but remains stronger than Q1. Smaller firms reversed course, as Mid, Small, and Micro Caps all rebounded with large sales momentum increases.
Perception for the Professional
May 2026 Issue

Featured Articles
Sector Navigator
May 2026 Issue
