Stock Market Internals Earnings Momentum, Small/Mid/Large Caps, Growth/Value/Cyclicals, and Additional Factors
Additional Factors

Although the volatility measures couldn’t match last August, the S&P 500 still managed to reach a new contemporary low of 1812 on January 20th. Our Equal Weighted Average has had just one monthly win since its relative strength peak in March of 2015.
Earnings Momentum

The third month of Q3 2015 earnings reports registered an Up/Down Ratio of 1.12. With only 52% of firms reporting higher earnings, the lack of earnings growth isn’t confined to just the Energy and Materials sectors.
Small Cap vs Mid Cap vs Large Cap

Our Ratio of Ratios crashed through its historical median of 4% in December and barely clings to its premium. This ends a period of almost seven years above the median.
Growth vs Value vs Cyclicals

In each of our three market cap breakdowns, Growth prevailed over Value, but Large Cap Growth was the only segment with a positive return, at a strong +9%. Growth stocks have experienced impressive outperformance since the middle of 2014.
Additional Factors

Our Equal Weighted Average for the index continued its streak of underperformance—losing to the Cap Weighted measure in nine of the last 10 months of 2015. The largest 25 firms were certainly the bright spot for the year—up 7.5% on average.
Earnings Momentum

The second month of Q3 2015 earnings reports registered an Up/Down Ratio of 1.11. On its own, the month of November was particularly weak with a stand-alone Up/Down Ratio of 0.97.
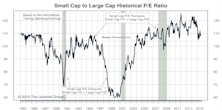
Small Cap vs Mid Cap vs Large Cap

Our Ratio of Ratios Small Cap premium bounced off its historical median as Large Caps underperformed in November.
Growth vs Value vs Cyclicals

Despite Large Cap Growth lagging in November, it has been a much better year for Growth stocks. All three Value segments remain in negative territory YTD.
Additional Factors

After three dramatic months, the S&P 500 held in a narrower range in November. Big Tech names like Microsoft (+3%), Google (+4%), and Amazon (+6%) outperformed once again and our Cap Weighted measurement continued to roll—it has beat the Equal Weighted Average in eight of the last nine months.
Earnings Momentum

Up/Down Earnings: Worst Start In Six Years
Small Cap vs Mid Cap vs Large Cap
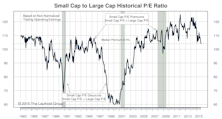
Small Cap Premium Drops To 4%
Growth vs Value vs Cyclicals

Growth Edges Out Value As Stocks Rebound
Additional Factors

S&P 500: Best Month In Four Years
Earnings Momentum

The third and final month of Q2 earnings reports registered an Up/Down Ratio of 1.18. This is the second lowest “three month” reading of the past 23 quarters.
Small Cap vs Mid Cap vs Large Cap

Small Cap Premium Down To 7%
Growth vs Value vs Cyclicals

Cruel Quarter, Growth Still Best YTD
Additional Factors

S&P 500: Worst Quarter In Four Years
Earnings Momentum

The second month of Q2 earnings reports registered an Up/Down Ratio of 1.17. This “two-month” figure is the third lowest since mid 2009.
Small / Mid / Large Cap
The August market action deflated P/E ratios across all market cap tiers, but our ratio of ratios was little changed.
Growth / Value / Cyclicals

Despite the down market, Large Cap Growth expanded its YTD outperformance over Value—now almost 11%.
Perception for the Professional
May 2026 Issue

Featured Articles
Sector Navigator
May 2026 Issue
