Stock Market Internals Earnings Momentum, Small/Mid/Large Caps, Growth/Value/Cyclicals, and Additional Factors
Additional Factors

After all the hoopla about the Chinese downturn, plunging oil, an impending recession, the widening of spreads, a Trump presidency and Brexit, the S&P 500 posted two quarterly gains of 1% and 2%, respectively.
Earnings Momentum

Adding in the second month of Q1 2016 earnings reports, the Up/Down Ratio now sports a 1.07 reading. May was another net “down” month with a stand-alone reading of 0.96.
Small Cap vs Mid Cap vs Large Cap

Small Caps are selling at a 3% valuation discount using non-normalized trailing operating earnings. This figure is very close to our contemporary low set at the end of January.
Growth vs Value vs Cyclicals

Our Deep Cyclical group took a breather in May but is still up almost 9% for the YTD. The Mid and Small Cap Value segments have also performed well this year.
Additional Factors

The dark days of January and February seem but a distant memory. After three positive performance months in a row, the S&P 500 closed out May within spitting distance (1.6%) of its all-time high set almost exactly one year ago.
Earnings Momentum

The first month of 2016 earnings reports registered a pathetic Up/Down Ratio of 1.27. With all the talk of large year-over-year earnings declines, this figure is not much of a surprise.
Small Cap vs Mid Cap vs Large Cap

After nearly seven years of relatively high Small Cap P/E ratios, our Ratio of Ratios has now spent five consecutive months below its long-term average Small Cap premium of 4%.
Growth vs Value vs Cyclicals

Value stocks finished ahead of Growth within all three market cap tiers in April. Our Deep Cyclical group, all but forgotten for the last few years, has been on a relative hot streak compared to Large Cap Growth.
Additional Factors

Apple lost $84 billion in market cap (roughly the value of Starbucks) for the month of April. The firm now sits 32% below its all-time market cap high of $750 billion set in May of 2015. Apple’s fall, and increased market participation, have boosted returns for the Equal Weighted S&P Average.
Earnings Momentum

The final month of 2015 earnings reports registered an Up/Down Ratio of 1.07. Once again, we have to go back to the dark days of 2009 to find a lower “three-month” ratio.
Small Cap vs Mid Cap vs Large Cap
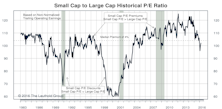
After spending two months in discount territory, in March the Ratio of Ratios headed closer to its historical median premium of 4%.
Growth vs Value vs Cyclicals

Signs of a leadership change are starting to spring up between Growth and Value. Since mid-2015, Mid and Small Cap Value stocks have outperformed Growth.
Additional Factors
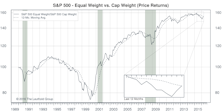
From the lows on February 11th to the end of March, the S&P 500 rallied nearly 14%, propelling the index into positive territory for the YTD. Our Equal Weighed Average sprung back to life in the past two months; the largest handful of firms are no longer driving performance.
Additional Factors

February turned out to be a month of trend reversals.
Earnings Momentum

The second month of Q4 2015 earnings reports registered an Up/Down Ratio of 1.12—up from the post- financial crisis low of 1.11 last quarter. With 51% of the observations in February, the “Up” count edged out the “Down,” but barely.
Small Cap vs Mid Cap vs Large Cap
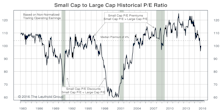
The Ratio of Ratios bounced off last month’s multi-year low (4% Small Cap discount) but still sits firmly below its Small Cap median, which is a premium of 4%.
Growth vs Value vs Cyclicals

Small Cap Growth stocks have gotten off to a rotten start in 2016—down almost 12%. On a relative basis, the segment has also been lagging Small Cap Value—underperforming by 9% since last July.
Earnings Momentum

Median YOY revenue growth figures for Q4 look awfully similar to the past few quarters—many market cap segments and sectors barely cling to positive readings. Market action is starting to take some of the fluff out of the LTM Price to Sales ratio.
Small Cap vs Mid Cap vs Large Cap

Small Cap underperformance in January helped push our Ratio of Ratios into discount territory for the first time since the end of 2008.
Growth vs Value vs Cyclicals

Despite Growth lagging severely in the two smaller market cap segments, Large Cap Growth, the darling of 2015, was the best performer in the brutal month of January.
Perception for the Professional
May 2026 Issue

Featured Articles
Sector Navigator
May 2026 Issue
